Designing a Logs-to-Metrics Real-Time Alerting Pipeline
A system design interview guide to turning a firehose of logs and events into metrics in real time, and paging a human only when something is genuinely wrong — with the false-positive rate kept ruthlessly low.
Student edition · start with the guarantee
Extract stable metrics from events and alert on user-relevant budget consumption without hiding missing data.
Correctness contract: Dedup/checkpoint semantics match metric type; windows define lateness/corrections; alert ratios handle no traffic and missing telemetry explicitly.
Basic HTTP, databases, and programming are assumed. Specialized terms are explained below. Named products motivate the problem; this is an educational design, not a claim about their current internals. Capacity numbers are illustrative decimal payload estimates, not benchmarks. Add indexes, protocol overhead, replicas, headroom, and failure capacity before provisioning.
Every request, error, and state change a service emits shows up first as a log line or an event. On their own these are unstructured and endless; nobody can watch them scroll by. The job of a logs-to-metrics pipeline is to distill that stream into a small number of meaningful metrics — error rate, p99 latency, throughput — and then to alert on those metrics in a way that catches real incidents fast without crying wolf. The hard part is almost never the extraction; it is the alerting. A pipeline that pages on every blip trains its on-call to ignore it, and an ignored alert is worse than no alert at all. This guide builds the pipeline from the stream inward: extraction and windowed aggregation, keeping cardinality under control, the rules engine, thresholds versus anomaly detection, multi-window multi-burn-rate alerting borrowed from Google’s SRE practice, and the dedup, grouping, and flap-damping layers that decide whether a human’s phone actually buzzes.
Each definition includes a concrete example and the condition under which the mechanism is useful. You can read this guide without opening another guide.
Event time and watermarks
Event time is when the producer says an event happened; processing time is when a consumer handles it. A watermark is the processor's policy-driven estimate of event-time progress, used to emit and eventually clean up window state.
Example. An event for 12:00 arrives at 12:07. A 5-minute allowed-lateness policy may update its window, divert it to correction, or reject it according to the API contract.
Limit. Watermarks are not proof all earlier events arrived. Idle inputs, skew, and unbounded delay require explicit policies; later corrections must propagate to rollups and reports.
Rollups and weighted aggregation
A precomputed summary per time bucket. Sums and counts merge by addition, min/max by comparison. An average is derived as total sum divided by total count, not an unweighted average of bucket averages.
Example. One window has [10], another [20,20,20]. Merge sum=70 and count=4 to get 17.5, not the unweighted mean of window means (10+20)/2=15.
Limit. Do not sum cumulative counter snapshots to compute traffic, or average p99 values to get a global p99. Retain reset-aware counter increases or compatible histogram distributions.
Cardinality
The number of distinct identities a store must track. A metric series is its metric name plus the full label combination. The product of label-value counts is an upper bound when not every combination occurs.
Example. 100 hosts × 20 routes × 5 status codes can produce up to 10,000 series. Adding a unique request_id can make every request create a new series.
Limit. Hashing every ID to a distinct digest does not reduce cardinality or guarantee anonymity. Use bounded categories, explicit limits, or intentional fixed-bucket aggregation.
Burn-rate alerting
Burn rate is the observed bad-event fraction divided by the allowed bad fraction. Multi-window alerts require sustained long-window burn and a confirming short window so old incidents can clear.
Example. For a 99.9% SLO, 2% errors is 20× burn. In a 30-day window, 14.4× time-normalized burn for one hour consumes 14.4/720=2% of budget.
Limit. That conversion assumes time-based measurement or roughly representative request volume. Low traffic, missing telemetry, and denominator-zero need policy; an alert alone does not guarantee response.
SLIs, SLOs, and error budgets
An SLI measures a user-relevant outcome; an SLO sets its target over a window. For a success-ratio SLO, the allowed bad fraction is 1−SLO. An SLA is a contractual commitment that may use different definitions.
Example. 99.9% successful requests over 1 billion requests allows 1 million bad requests. A time-based 30-day availability target instead allows 43.2 unavailable minutes.
Limit. Request and time budgets are not interchangeable under variable traffic or partial failure. SLOs are not universally stricter than SLAs; choose both from their definitions and user needs.
Offsets and checkpoints
An offset is a position in one log partition. A checkpoint is a recoverable, consistent record of input positions and processing state. On restart, state must correspond exactly to the input that is considered processed.
Example. If a batch increments a total and crashes before saving its offset, replay increments twice. Commit the total, dedup state, and partition position together, or use a compatible transactional/idempotent sink.
Limit. Saving an offset after a write avoids that specific loss window but can still duplicate; framework checkpoints alone do not make arbitrary external effects transactional.
1. Requirements & Scope
Intuition
A smoke alarm does not read every molecule in the air. It counts particles per second and beeps when the count stays high. This pipeline does the same with logs: turn a flood of lines into a few numbers, then page only when a number stays bad.
Clarifying questions to ask
Events per second and average size?
How fast must a page arrive? 30 s, or 5 minutes?
Do we have SLOs, so we can alert on error budget burn?
Which tags are allowed on metrics? Is user_id banned?
How late can events arrive?
Who gets paged, and how do alerts reach them?
Before drawing boxes, pin down what the pipeline must do. The interviewer is watching whether you separate the loud requirement (extract metrics) from the subtle one (alert without noise).
Functional. Consume a high-volume log/event stream; extract numeric metrics via parsing and aggregation; evaluate alerting rules continuously; group and deduplicate firing rules into incidents; route notifications to the right on-call with the right urgency.
Latency. Detection latency — event to page — should be tens of seconds, not minutes. An alert that arrives ten minutes late has let the incident run ten minutes unattended.
Low false positives. The primary quality metric is precision of alerts. A high recall (catch everything) that also pages constantly is a failure, because humans stop trusting it.
Reliability. The alerting path must be more available than the systems it watches. If the pipeline dies silently, every service looks healthy.
Non-goals. Long-term log storage, full-text search, and forensic drill-down belong to a log store; here we keep only enough to compute and alert on metrics.
2. Back-of-the-Envelope
Rough numbers set the shape of the design and show you can reason about scale. Assume a mid-size fleet emitting a steady event stream.
~300K points/sec (3M series ÷ 10 s) — a ~70× reduction
Alert rules
~5K rules, each over a handful of windows
evaluated every 10–30s tick
Detection budget
ingest + window + evaluate + route
≤ ~30s end to end
Worked estimate, step by step
Step
Math
Result
Raw bytes
1M events/s × 500 B
500 MB/s
Raw per day
500 MB/s × 86,400 s
≈ 43 TB/day
Metric updates
1M events/s × 20 metrics
20M updates/s
Points out
3M series ÷ 10 s flush
300K points/s
Window state
3M series × 6 open windows × ~100 B
≈ 1.8 GB (sharded)
Fast-burn line (99.9% SLO)
0.1% budget × 14.4
error ratio ≥ 1.44%
Detection budget
ingest + window + evaluate + route
≤ ~30 s
Read the table
The state is small once tags are bounded. One bad tag like request_id would turn 3M series into billions. That is why cardinality is the real limit.
The headline is the reduction: aggregation collapses tens of millions of per-event updates into a few hundred thousand metric points per second. That collapse is what makes real-time alerting affordable — you evaluate rules over compact aggregates, never over raw logs.
3. Metrics & Rule Definitions
Two definitions carry the whole design: what a metric is, and what an alerting rule is. Getting them precise up front keeps the later layers simple.
A metric extracted from the stream is the familiar time-series tuple: a name, a set of bounded key-value tags, a timestamp, and a value. Metrics come in the usual shapes — a counter for events (requests, errors), a gauge for levels (queue depth), and a histogram for distributions (latency), from which quantiles like p99 are computed.
An alerting rule binds a query over those metrics to a condition, a duration, and a routing decision:
# a rule is data, not code — declarative and version-controlled
rule high_error_rate:
  expr:      rate(errors[5m]) / rate(requests[5m])   # the SLI
  condition: > 0.02                                    # error ratio above 2%
  for:       2m                                        # must persist to fire
  labels:    { severity: page, team: checkout }
  group_by:  [service, region]                         # dedup dimension
Field
Purpose
expr
The metric query — a rate, ratio, or quantile computed over a window.
condition
The threshold or anomaly test that decides “bad.”
for
How long the condition must hold before firing — the first line of noise defense.
labels
Severity and routing metadata attached to the resulting alert.
group_by
The dimensions along which firing instances collapse into one incident.
Threshold vs burn rate
The 2% rule above is a plain threshold on the error ratio. For a 99.9% SLO the budget is 0.1%, so 2% errors is a 20× burn. The burn-rate section below shows how to set such lines from the SLO instead of guessing.
4. API & Data Model
# rules are data: CRUD over a versioned store
PUT  /api/rules/{id}        { expr, condition, for, labels, group_by, burn_windows? }
GET  /api/alerts?state=firing&team=checkout
POST /api/silences          { matchers: {service: "cart"}, starts_at, ends_at, reason }
POST /api/alerts/{id}/ack   { user }

# internal records
MetricPoint { name, tags{service, endpoint, status, region}, window_end, value | histogram }
AlertState  { key=(rule, group_labels), state: pending|firing|resolved, since, last_eval, fingerprint }
The alert key (rule, group_labels) is what dedup uses. Keep AlertState in a replicated store so a rules-engine restart does not re-page everyone.
5. High-Level Architecture
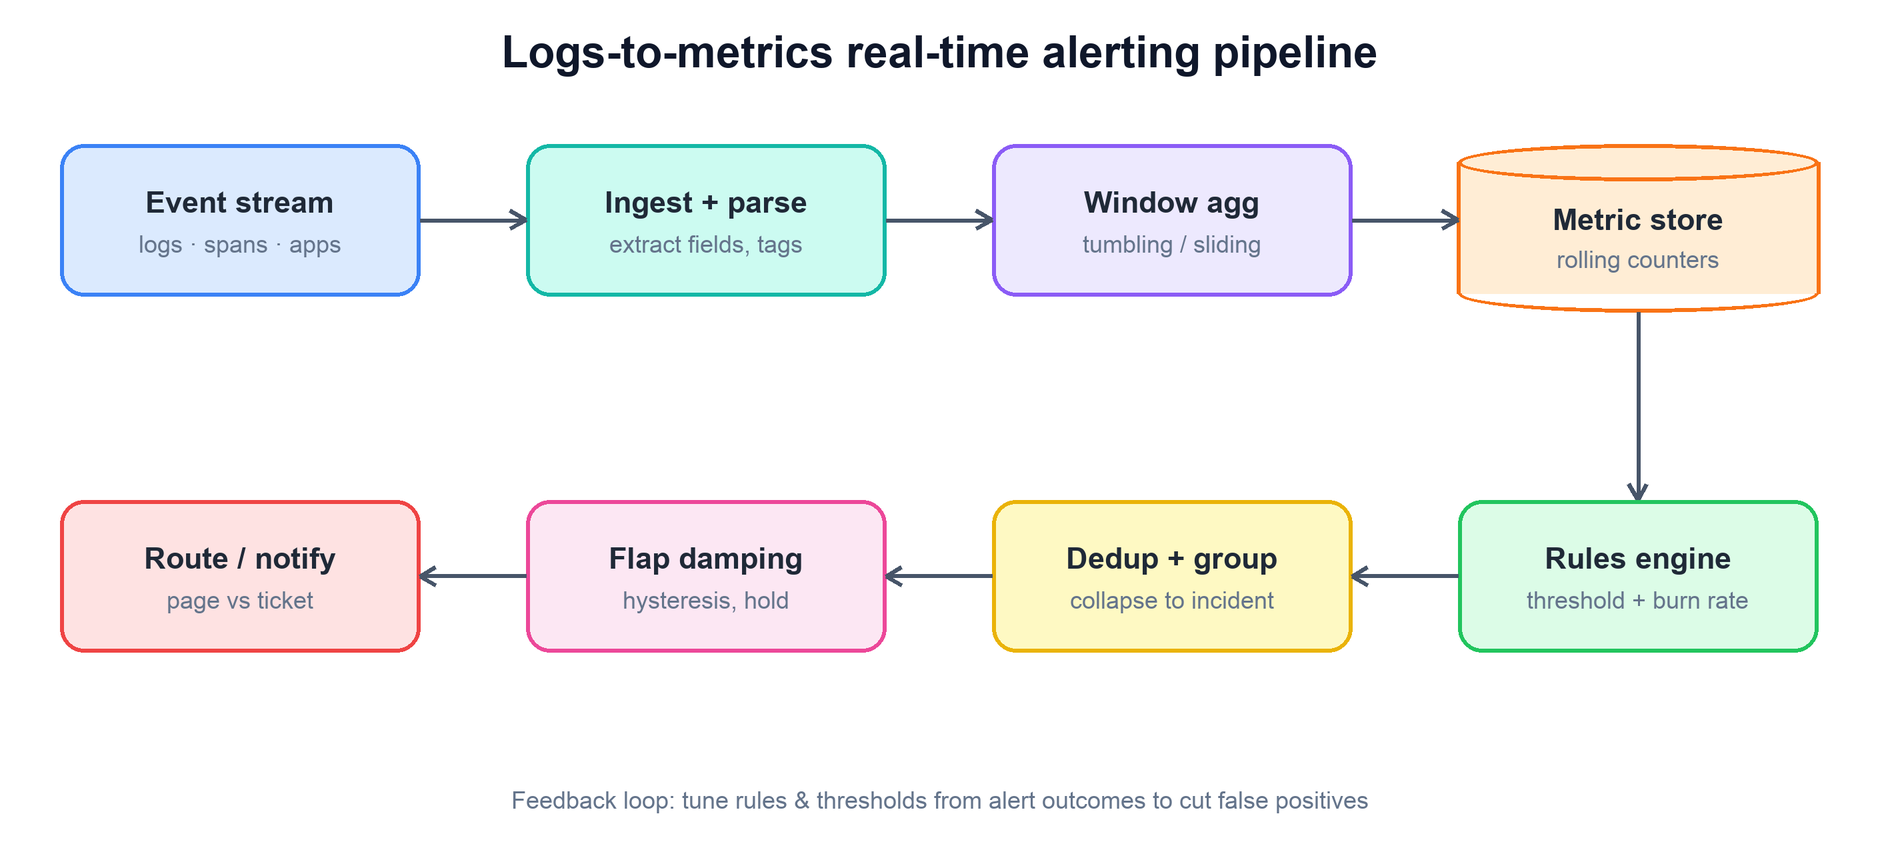
The pipeline is a directed flow from raw stream to human. Each stage does one job, and the noise-reduction stages sit deliberately near the end, after the metric has already been computed.
Events flow from the stream through parsing and windowed aggregation into a metric store; the rules engine evaluates against it, then dedup/grouping, flap damping, and routing decide whether — and whom — to page. A feedback loop tunes rules from alert outcomes.
Event stream. A durable, partitioned log (Kafka-style) buffers the firehose and lets consumers scale out and replay. Partitioning by a stable key keeps a given series’ events on one consumer.
Ingest + parse. Stateless workers parse each event, extract fields, and emit metric updates with bounded tags. This layer scales horizontally with the stream.
Window aggregation. Updates are folded into time windows per series — the step that turns millions of events into compact points.
Metric store. A short-retention time-series buffer holds recent aggregates for rule evaluation; long history can spill to a full TSDB.
Rules engine. Evaluates each rule on every tick against the store, producing candidate alerts.
Dedup, flap damping, routing. Collapse duplicates, suppress flapping, and deliver to the right on-call at the right urgency.
6. Windowing & Cardinality
Tumbling windows are half-open nonoverlapping intervals; sliding windows overlap. Events use event time under a source trust/clock policy. Watermarks estimate progress, not proof every older event arrived; idle partitions, clock skew, and allowed-lateness settings matter.
Emit provisional results, allow documented updates/retractions, and clean state when the retention/lateness policy permits. Events beyond that horizon are quarantined/corrected/dropped visibly. A downstream alert should distinguish finalized windows, delayed telemetry, and no data rather than silently treating missing counts as zero.
Series cardinality is the number of observed label combinations, bounded above by the product of label counts. Hashing an unbounded user ID usually preserves its cardinality; use a fixed finite bucket mapping only if aggregate semantics permit it. Dedup/count checkpointing is required for exact event counters; histogram/rollup merges need compatible definitions.
7. Thresholds, Anomalies & Burn Rate
Burn rate = bad-event fraction/(1−SLO). For 99.9%, 2% errors is 20×. Multi-window rules require a confirming short-window threshold as well as a long-window threshold, with minimum sample/coverage and missing-data policy. Thresholds are examples to tune from the SLO/window, not universal constants.
For a time-normalized 30-day window, 14.4× over 1h consumes 2% of budget; 6× over 6h consumes 5%; 1× over 3d consumes 10%. For a request-based budget, calculate consumed bad requests relative to the window's total eligible requests; variable traffic means time fractions alone are not exact. Group/dedup pages, define routing and response ownership, and avoid automatic threshold increases merely because an incident page was inconvenient.
8. Dedup, Grouping & Flap Damping
A rule that fires is not yet a page. Between firing and the phone buzzing sit the layers that turn many correlated signals into one actionable notification — the difference between a useful alert and an alert storm.
Deduplication. The same rule firing on the same target every tick is one alert, not hundreds. Alerts are keyed by rule plus group_by labels, and a repeat within an active window just refreshes the existing one.
Grouping. When a shared dependency fails, dozens of rules fire at once. Grouping collapses them by a common dimension — region, cluster, service — into a single incident notification, so on-call gets one page describing the blast radius instead of forty.
Flap damping. A metric hovering at the threshold flips fire/resolve/fire endlessly. Hysteresis fixes it: fire above a high line, resolve only below a lower one, and hold a resolved alert for a cool-down before declaring it truly over.
Routing & escalation. The grouped, damped alert is routed by its labels to the owning team’s on-call, at page or ticket urgency, with escalation if unacknowledged and silences for known maintenance.
on rule_fires(alert):
  key = (alert.rule, alert.group_labels)     # dedup identity
  if active[key] and not cooled_down(key):
    active[key].refresh(); return            # dedup: same incident
  group = correlate(alert)                    # collapse related fires
  if flapping(key):
    hold(key); return                         # hysteresis + cool-down
  route(group, urgency=alert.severity)        # page vs ticket
Closing the loop, alert outcomes feed back into the rules. Every page that a human marks “not actionable” is evidence to raise a threshold, lengthen a for, or add a grouping dimension. Treating false positives as bugs to be fixed — not noise to be tolerated — is what keeps the pipeline trusted over time.
9. Bottlenecks & Tradeoffs
The interesting failure modes cluster around state, latency, and the perennial tension between catching everything and paging too much.
Cardinality vs granularity. More tags mean richer slicing but combinatorial series growth. The trade is resolved by curating tags and normalizing high-variety fields, accepting coarser granularity to stay within a series budget.
Latency vs stability. Short windows and small watermark grace detect faster but emit noisier, more revisable results; longer windows are stable but slow. Burn-rate tiers let you have both — fast pages for severe burns, slow tickets for gradual ones.
Precision vs recall. Every noise defense that raises precision (longer for, higher burn threshold) risks missing a genuine slow-burn issue. The multi-tier design is precisely a way to buy recall on the slow path without sacrificing precision on the fast one.
Pipeline availability. The alerting path must outlive what it watches. That means running it in a separate failure domain, monitoring the monitor with a dead-man’s switch (a heartbeat alert that fires if the pipeline goes quiet), and degrading gracefully when the stream lags.
Stateful aggregation. Windowed state is the scaling limit; it must be partitioned by series key, checkpointed for recovery, and bounded so a cardinality spike cannot exhaust memory.
10. Failure Modes
Failure
What happens
Defense
Stream consumer lag
Metrics are stale; alerts are late or wrong
Alert on consumer lag itself; scale consumers; evaluate on event time
Pipeline dies silently
No alerts, so everything looks fine
Dead-man’s switch heartbeat to an outside system
Cardinality spike
Aggregator runs out of memory
Per-metric series caps; drop or bucket unknown tag values
Rules engine restarts
Pending timers reset, or alerts re-fire
Persist AlertState; resume for timers from it
Missing data (no events)
Ratio is 0/0; rule neither fires nor resolves
Explicit absent-data rules; treat no data as its own alert
Worked example: a 99.9% SLO burns quickly
The allowed bad fraction is 0.001; measured error fraction is 0.02.
Read top to bottom. The table below explains the state and guarantee at each step.
Step
State, calculation, and reasoning
1. Compute burn
0.02/0.001=20× burn. Error count alone does not say this without total request count.
2. Confirm across windows
Require long-window and short-window burn above the threshold. The short window helps clear a resolved incident; dwell time/coverage rules also matter.
3. Convert a time-normalized example
At 14.4× burn for one hour in a 720-hour month, budget consumed is 14.4/720=2%. For request budgets, use actual window request volume rather than assuming uniform traffic.
4. Handle no data
A zero denominator is not a healthy 0% error rate. Treat no traffic, missing ingestion, and service unavailability as distinct states and route appropriately.
Check your understanding: Can you average shard p99 values to get service p99?
No. Merge compatible histogram/sketch distributions and compute the quantile. Means and percentiles need different sufficient state.
Run a small, testable model
Download concepts.py. It uses only the Python 3.10+ standard library. From the directory where you saved it, run:
python3 concepts.py observability
python3 concepts.py test
The model checks burn arithmetic and shows why hash digests do not reduce label cardinality.
The program contains deterministic assertions and failure traces. It is a learning model, not a production service: it does not implement network consensus, distributed durability, authentication, or third-party delivery. Read its contracts and try changing an input before extending it.
Windows, event time, watermarks, cardinality caps.
28–38
Multi-window burn-rate alerting with the numbers.
38–45
Dedup, grouping, hysteresis, and watching the watcher.
12. Common Mistakes
Watch out
Evaluating rules over raw logs instead of aggregates.
Using arrival time instead of event time, so late data corrupts windows.
One static threshold for all hours of the day.
No for duration, so every blip pages.
No alert when the pipeline itself goes quiet.
13. Summary
A logs-to-metrics alerting pipeline earns its keep not by extracting metrics — that part is easy — but by paging a human only when it matters. Every layer past aggregation exists to raise precision without losing the incidents that count.
Concern
Mechanism
How do we cut the firehose down?
Windowed aggregation collapses per-event updates into compact series — a large reduction.
How do we aggregate correctly?
Event-time windows (tumbling or sliding) driven by watermarks, with a grace period for late data.
What is the dominant scaling limit?
Cardinality — curate bounded tags, normalize high-variety fields, cap series per metric.
Static line or adaptive?
Thresholds for SLO-backed signals; anomaly detection for seasonal shapes a fixed line misses.
How do we page fast yet precisely?
Multi-window multi-burn-rate: long window for sensitivity, short window to confirm and reset.
How do we avoid alert storms?
Dedup by rule+labels, group correlated fires into one incident, damp flapping with hysteresis.
How do we keep it trusted?
Feed alert outcomes back to tune rules; treat every false positive as a bug to fix.
How do we keep the monitor alive?
Separate failure domain plus a dead-man’s switch that fires if the pipeline goes silent.
The recurring theme: the value is in the noise reduction. Aggregate to make evaluation cheap, control cardinality so state stays bounded, alert on budget burn rather than raw values, and stack dedup, grouping, and damping so one real problem produces exactly one trustworthy page.
14. Check Yourself
What is the difference between tumbling and sliding windows?Answer
Tumbling windows do not overlap, so each event is in one window. Sliding windows overlap, so each event counts in several and the curve is smoother.
What does a watermark tell the aggregator?Answer
It says we have probably seen all events up to time T. Windows that end before it can be emitted. Later events go to a side output.
A 30-day 99.9% SLO burns at 14.4×. How long until the budget is gone?Answer
30 ÷ 14.4 ≈ 2.1 days. One hour at that rate uses 14.4 ÷ 720 = 2% of the month’s budget.
Why pair a long window with a short window?Answer
The long window proves the burn is real. The short window proves it is still happening, so the alert resets soon after recovery.
What is hysteresis in alerting?Answer
Fire above a high line and resolve only below a lower line. It stops an alert from flapping at the threshold.
How do you know the alerting pipeline is alive?Answer
It sends a steady heartbeat alert to an outside system. If the heartbeat stops, that system pages.
15. Key Terms
Counter / gauge / histogram
Count, level, and distribution metrics.
Tumbling window
Fixed, non-overlapping time bucket.
Sliding window
Overlapping bucket that steps forward.
Watermark
Event time is when the producer says an event happened; processing time is when a consumer handles it. A watermark is the processor's policy-driven estimate of event-time progress, used to emit and eventually clean up window state. Example and limits above.
SLO
An SLI measures a user-relevant outcome; an SLO sets its target over a window. For a success-ratio SLO, the allowed bad fraction is 1−SLO. An SLA is a contractual commitment that may use different definitions. Example and limits above.
Error budget
An SLI measures a user-relevant outcome; an SLO sets its target over a window. For a success-ratio SLO, the allowed bad fraction is 1−SLO. An SLA is a contractual commitment that may use different definitions. Example and limits above.
Burn rate
Burn rate is the observed bad-event fraction divided by the allowed bad fraction. Multi-window alerts require sustained long-window burn and a confirming short window so old incidents can clear. Example and limits above.