A system design interview guide to building a tracing system that follows one request across dozens of services, so you can see exactly where the latency and errors went — the machinery behind Dapper, Jaeger, Tempo, and OpenTelemetry.
Student edition · start with the guarantee
Connect distributed operations through propagated identities and interpret incomplete, sampled traces honestly.
Correctness contract: Trace IDs/links propagate through supported synchronous/asynchronous boundaries; retention, sampling coverage, clock uncertainty, and missing spans are visible.
Basic HTTP, databases, and programming are assumed. Specialized terms are explained below. Named products motivate the problem; this is an educational design, not a claim about their current internals. Capacity numbers are illustrative decimal payload estimates, not benchmarks. Add indexes, protocol overhead, replicas, headroom, and failure capacity before provisioning.
In a microservice architecture a single user request fans out across dozens of services, and when it is slow or fails, metrics tell you that something is wrong and logs tell you what happened on one machine — but neither tells you where, across the whole call path, the time went. Distributed tracing answers that by stitching together the work done for one request into a single causal timeline. The idea, popularized by Google’s Dapper paper and now standardized by OpenTelemetry, is to tag each request with a trace id, propagate it across every service hop, and have each service emit timed spans that a backend reassembles into a tree. This guide builds that system: the trace and span model, context propagation over the wire, the collector pipeline, the all-important sampling decision (head vs tail), storage at petabyte scale, and trace assembly into waterfalls and dependency graphs.
Each definition includes a concrete example and the condition under which the mechanism is useful. You can read this guide without opening another guide.
Spans and trace context
A span records one operation with a trace ID, span ID, parent or links, timing, and attributes. Context propagation sends the current trace/span identity across HTTP, RPC, thread, and queue boundaries so related work can be assembled.
Example. A gateway starts a trace, injects W3C traceparent into a service call, and the service links its queue consumer work to the producer span.
Limit. Cross-host wall clocks can skew timelines. A parent-child graph is not always a tree because asynchronous work can have multiple links. Instrumentation must be configured; IDs are not automatically present in every log.
Head and tail sampling
Head sampling decides at trace start. Tail sampling buffers received spans and decides after a configured decision interval using observed errors/latency. Sampling reduces retained volume but introduces coverage and bias choices.
Example. A 1% head sampler forwards only one in 100 traces. A later tail sampler cannot recover an error trace that the head stage never sent.
Limit. No tail policy guarantees all errors when input spans are lost, dropped, late, or evicted. Route compatible trace state together, bound memory, and report coverage before drawing aggregate conclusions.
Transactional outbox
A business transaction writes its state change and an event row to the same database. A relay publishes committed event rows later, retrying until the broker durably accepts them.
Example. An order and its OrderCreated outbox row commit together. A relay crash after publish but before marking sent publishes the same event ID again on restart.
Limit. The relay is at-least-once, not magically exactly-once. Consumers dedup transactionally; preserve per-entity sequence when order matters. CDC is change data capture: reading committed database changes.
Cardinality
The number of distinct identities a store must track. A metric series is its metric name plus the full label combination. The product of label-value counts is an upper bound when not every combination occurs.
Example. 100 hosts × 20 routes × 5 status codes can produce up to 10,000 series. Adding a unique request_id can make every request create a new series.
Limit. Hashing every ID to a distinct digest does not reduce cardinality or guarantee anonymity. Use bounded categories, explicit limits, or intentional fixed-bucket aggregation.
SLIs, SLOs, and error budgets
An SLI measures a user-relevant outcome; an SLO sets its target over a window. For a success-ratio SLO, the allowed bad fraction is 1−SLO. An SLA is a contractual commitment that may use different definitions.
Example. 99.9% successful requests over 1 billion requests allows 1 million bad requests. A time-based 30-day availability target instead allows 43.2 unavailable minutes.
Limit. Request and time budgets are not interchangeable under variable traffic or partial failure. SLOs are not universally stricter than SLAs; choose both from their definitions and user needs.
1. Requirements & Scope
Intuition
Picture a parcel with a tracking number. Every depot scans it and writes the time. Later you read all scans for that number and see where it got stuck. A trace is the same: the trace_id is the tracking number and each span is one scan.
Clarifying questions to ask
Requests per second, and spans per request?
Must we trace async work, such as queues and batch jobs?
How long do we keep traces? Days or weeks?
Must every error trace be kept, or is a random sample fine?
Do users search by attributes, or only open a trace by id?
What overhead budget do services allow? Under 1% CPU is typical.
The system captures the end-to-end path of requests and lets an engineer inspect any one of them. Pin down the requirements.
Functional. Capture spans across all services for a request; reassemble them into a trace (a tree/waterfall); let users search traces by attributes (service, latency, error, trace id) and view a single trace’s timeline; derive a service dependency graph and latency breakdowns.
Low overhead. Instrumentation must add negligible latency and CPU to the traced services — tracing that slows production is worse than no tracing.
Scale. Millions of spans per second raw; petabytes of trace data if unsampled — so sampling is a core requirement, not an add-on.
Correlation. Traces must link to logs and metrics via shared ids so investigation crosses pillars.
Freshness. A trace should be viewable within seconds of the request completing.
Interview tip: The two make-or-break topics are context propagation (how the trace id crosses every service boundary, including async and message queues) and sampling (how you keep the interesting traces without storing everything). Spend your time there; an interviewer probing tracing is almost always probing one of those two.
2. Back-of-the-Envelope Estimates
Assume 1,000,000 requests/second, each producing 20 spans across services, each span ~1 KB.
Quantity
Estimate
Volume math
Raw spans
~20M spans/s
1M req/s × 20 spans.
Raw volume (unsampled)
~20 GB/s → ~1.7 PB/day
20M spans/s × 1 KB × 86,400 s — infeasible to store fully.
After 1% sampling
~200k spans/s → ~17 TB/day
Sampling is what turns petabytes into a manageable stream.
Retained (7 days)
~120 TB
17 TB/day × 7; object storage keeps this cheap.
Trace assembly window
seconds
Spans of one trace arrive within seconds; assembly and tail-sampling buffer over that window.
Worked estimate, step by step
Step
Math
Result
Raw spans
1M req/s × 20 spans
20M spans/s
Raw bytes
20M × 1 KB
20 GB/s
Raw per day
20 GB/s × 86,400 s
≈ 1.7 PB/day
Kept after 1%
1.7 PB × 0.01
≈ 17 TB/day
Tail-sampling buffer
20 GB/s × 30 s decision window
≈ 600 GB RAM (fleet-wide)
7-day retention
17 TB × 7
≈ 120 TB on object storage
Read the table
The 600 GB buffer is the hidden cost of tail sampling. It must be spread over many collectors, sharded by trace_id.
The dominant conclusion is unavoidable: at 1.7 PB/day raw, you cannot store every trace, so sampling is the central design decision — and where you make it (at the source vs after buffering the whole trace) shapes the entire pipeline.
3. The Trace & Span Model
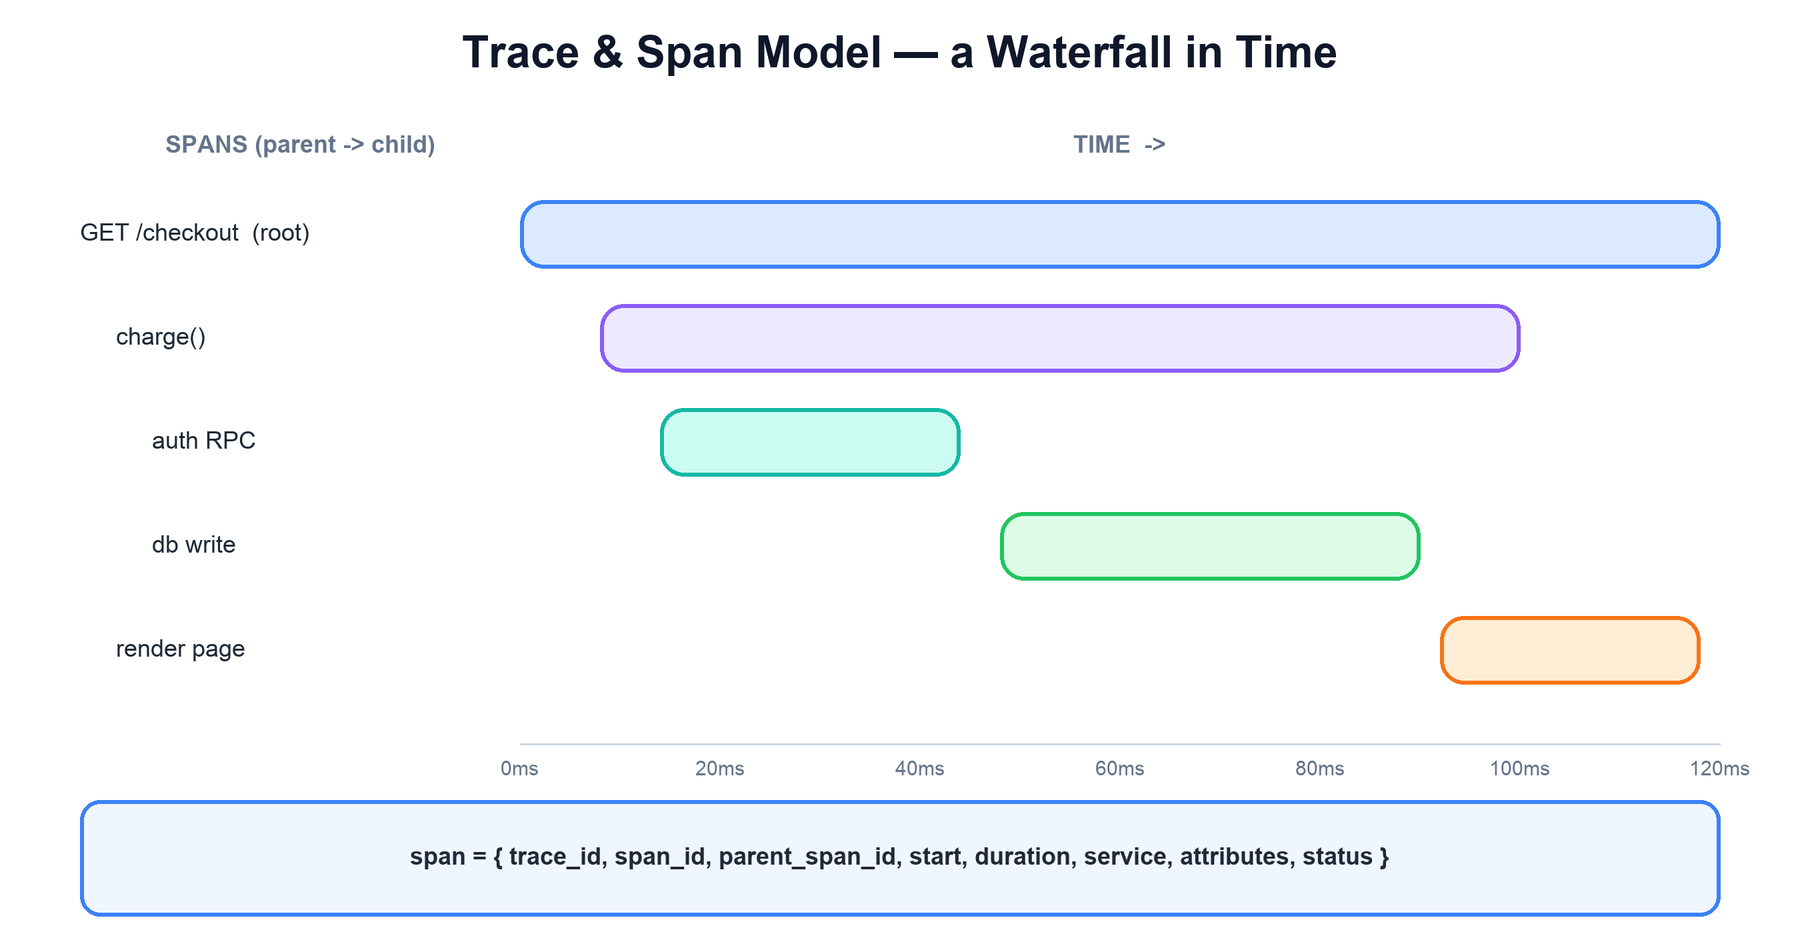
The data model is small and worth stating precisely. A span is a single named, timed unit of work — one operation in one service. A trace is the collection of all spans for one request, linked into a tree by parent references.
A trace is a tree of spans rendered as a waterfall over time. The root span (GET /checkout) spans the whole request; child spans (charge, auth RPC, db write, render) nest under it with their own start times and durations. Each span carries a trace_id, span_id, parent_span_id, timing, and attributes.
Each span carries:
trace_id — the same for every span in the request; the join key for the whole trace.
span_id — unique to this span.
parent_span_id — the span that caused this one; null for the root. This is what builds the tree.
start time & duration — the timing that makes the waterfall.
service / operation name, status, and attributes — tags (http method, db statement, error) and events for detail.
The parent/child links are the essence: the backend does not need spans to arrive in order or together — it just needs each span’s trace_id and parent_span_id to reconstruct the tree later. That decoupling is what lets spans stream in independently from many services.
4. Instrumentation & Context Propagation
The hard part of tracing is not recording a span — it is making sure every service in the request shares the same trace_id. That is context propagation, and it is what turns per-service spans into one coherent trace.
How it works. When a request enters the system, the first service either reads an incoming trace context or starts a new trace. On every outbound call it injects the current trace context into the request — for HTTP, the W3C Trace Context standard puts it in the traceparent header. The next service extracts it, continues the same trace, and repeats. This propagation must cover every hop, including the tricky ones: async work, thread pools, and message queues (where the context rides in message metadata rather than an HTTP header).
# W3C traceparent header format
traceparent: 00-4bf92f3577b34da6a3ce929d0e0e4736-00f067aa0ba902b7-01
             |  |                                |                |
           version   trace-id (16 bytes)      parent span-id   flags (sampled)

# each hop: extract -> start child span -> inject into next call
ctx  = extract(request.headers)                # continue the trace
span = tracer.start_span("db.query", parent=ctx)
inject(outbound.headers, span.context())       # propagate downstream
Instrumentation — the code that starts/ends spans and does inject/extract — comes in two forms: automatic (agents and libraries that instrument common frameworks with no code changes) and manual (developers adding spans around important custom logic). OpenTelemetry provides both a vendor-neutral API/SDK and the propagation standard, which is why it has become the default: instrument once, and any backend can consume the spans. The flags byte in traceparent also carries the sampled bit, so a head-sampling decision made at the edge is honored by every downstream service.
The same traceparent rides in an HTTP header and then in a Kafka message header. The consumer span starts after the request ended, so it is often a span link rather than a child. The gap shows time spent waiting in the queue.
5. API & Data Model
# ingest (OTLP)
POST /v1/traces   ResourceSpans{ resource{service.name, host}, spans[ Span ] }
Span { trace_id: bytes16, span_id: bytes8, parent_span_id: bytes8|null,
       name, kind: SERVER|CLIENT|PRODUCER|CONSUMER|INTERNAL,
       start_unix_nano, end_unix_nano, status: OK|ERROR, attributes{}, events[], links[] }

# query
GET /api/traces/{trace_id}                         -> all spans, assembled as a tree
GET /api/search?service=orders&min_duration=2s&status=error&start&end&limit=20
GET /api/dependencies?start&end                  -> service graph edges with rate, errors, p99
Storage layout: span blocks in object storage, grouped by time and sorted by trace_id. A small per-block index (or bloom filter) answers “is this trace_id in this block?”.
6. High-Level Architecture
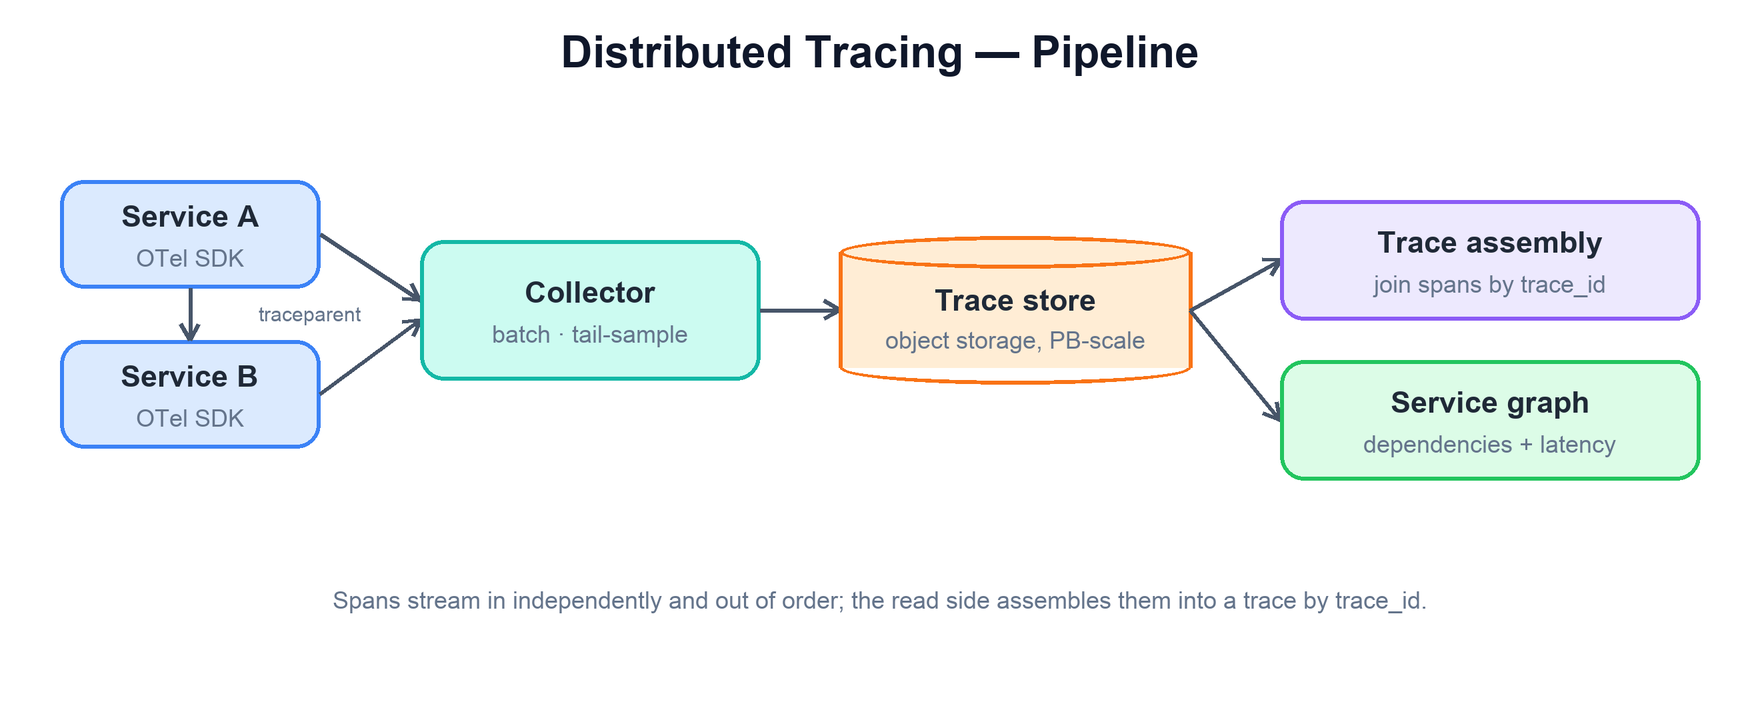
The pipeline moves spans from instrumented services, through a collector that batches and samples, into scalable storage, with a read side that assembles and analyzes traces.
Services propagate the trace context (traceparent) between each other and export spans to a collector, which batches and applies tail sampling. Spans are written to petabyte-scale object storage keyed by trace_id; the read side assembles spans into traces and derives a service dependency graph with latency breakdowns.
SDK / agent. In each service, records spans and propagates context with minimal overhead; buffers and exports spans asynchronously so tracing never blocks the request.
Collector. A tier (often the OpenTelemetry Collector) that receives spans, batches them, enriches them, and — critically — is where tail sampling happens, because it can see all spans of a trace before deciding. It shields storage from load spikes and applies policy centrally.
Storage. Spans keyed by trace_id in a store backed by cheap object storage, with a secondary index for search.
Query / UI. Assembles spans into a trace waterfall, supports search by attributes, and computes the service dependency graph.
7. Sampling: Head vs Tail
Head sampling decides before the outcome; a 1% independent sample keeps about 1% of errors on average. Tail sampling groups received spans by trace and decides after a configured interval, favoring observed errors/slow traces. It cannot know with certainty every span has arrived; late arrivals, eviction, and delivery loss weaken coverage.
A head+tail hybrid does not guarantee all errors: tail cannot recover traces discarded at the head stage. To target all observed errors, forward sufficient eligible traces/spans to tail first and provision bounded collector state, routing, and spill/drop policy. Separate cheap representative sampling from error-retention claims. Report missing-span and sampling coverage explicitly.
The W3C sampled flag communicates context; SDK/sampler policy may override it and should be configured consistently. Different fanout/batch work may use span links rather than one parent. A sampled dependency graph is biased unless corrected; avoid deriving fleet SLOs directly from a tail-biased trace set.
8. Storage, Assembly & Dependency Graphs
Storage. The access pattern is “fetch all spans for a trace_id,” so spans are stored keyed by trace_id. The cost-effective modern design (Grafana Tempo is the clearest example) keeps only a minimal index and writes span blocks to cheap object storage: you do not build a heavy search index over every span attribute; you look up by trace id, and support attribute search via a lighter secondary index or by scanning columnar blocks. This decouples storage cost from compute and is what makes petabyte retention affordable.
Trace assembly. Because spans arrive independently and out of order, the read side collects all spans sharing a trace_id and rebuilds the tree from parent_span_id links, then lays them on a timeline to produce the waterfall. Assembly is a read-time (or collector-time) operation; the write path never needs a complete trace.
Dependency graph & latency analysis. Aggregating across many traces yields a service dependency graph — which service calls which, how often, and with what latency and error rate — and per-operation latency breakdowns that reveal where the critical path spends its time. This aggregate view, computed from sampled traces, is often as valuable as any single trace: it shows the shape of the system and where to look when a whole tier degrades.
Correlation. Because the trace_id and span_id are injected into logs and attached to metric exemplars, a trace is the hub that ties the three observability pillars together — jump from a slow span to its logs, or from a metric spike’s exemplar to the trace.
9. Bottlenecks & Tradeoffs
Sampling rate vs fidelity. Sample too aggressively and you miss the trace you needed; too little and you cannot afford storage. Tail sampling on errors/latency is the best fidelity-per-byte, at the cost of collector complexity.
Instrumentation overhead vs coverage. More spans give more detail but add CPU and export volume. Auto-instrument the framework layer; add manual spans only where they earn their keep.
Tail-sampling routing. Tail sampling requires all spans of a trace to reach the same collector instance, so the collector tier must shard by trace_id — a real operational constraint that head sampling avoids.
Propagation gaps. A single service that does not propagate context breaks the trace into disconnected fragments. Coverage must be near-universal, which is why a standard (W3C + OpenTelemetry) matters.
Index cost vs search. A full index over span attributes enables rich search but costs as much as the data; a minimal trace-id index (Tempo-style) is cheap but limits attribute search. Choose based on how users query.
Clock skew. Spans come from different machines, so unsynchronized clocks distort the waterfall. Rely on causal parent/child ordering and good time sync, not absolute timestamps alone.
10. Failure Modes
Failure
What happens
Defense
Collector overloaded
Spans dropped; traces have holes
SDK export is async with a bounded queue; drop spans, never block requests; autoscale collectors
Spans of one trace hit different tail samplers
Each sees part of the trace and decides wrong
Two-tier collectors: a load-balancing exporter routes by trace_id
A service does not propagate context
Trace splits into orphan fragments
Standard W3C headers, auto-instrumentation, orphan-span dashboards
Late spans after the tail decision
Kept trace is missing children
Decision wait of 10–30 s; cache recent decisions so late spans follow them
Clock skew between hosts
Child appears to start before parent
NTP/PTP; UI clamps child spans inside the parent using causal links
Worked example: an error dropped before tail sampling
Assume 1000 traces, ten errors, and an independent 1% head sampler.
Read top to bottom. The table below explains the state and guarantee at each step.
Step
State, calculation, and reasoning
1. Make the head decision
About ten traces survive on average. Expected surviving errors are only 10×0.01=0.1, not all ten.
2. Apply a keep-all-observed-errors tail policy
It can retain errors that reached the collector. It cannot restore the 99% of traces discarded earlier.
3. Wait for late spans
Tail decisions use a bounded interval, not certain knowledge the whole trace finished. Late/missing spans can hide an error.
4. Report coverage
Expose sampling/drop rates and policy version. Use unsampled/appropriately weighted metrics for fleet-wide error rates, not biased tail-trace counts.
Check your understanding: Can head sampling plus tail sampling guarantee every error trace?
No. Tail only sees forwarded, delivered spans and is bounded by late arrivals, buffering, and outages.
Run a small, testable model
Download concepts.py. It uses only the Python 3.10+ standard library. From the directory where you saved it, run:
python3 concepts.py observability
python3 concepts.py test
The model quantifies pre-tail error loss and contrasts conditional retention with complete coverage.
The program contains deterministic assertions and failure traces. It is a learning model, not a production service: it does not implement network consensus, distributed durability, authentication, or third-party delivery. Read its contracts and try changing an input before extending it.
Deep dive head vs tail sampling. Size the tail buffer.
35–45
Queues and span links, storage index, service graph, failure modes.
12. Common Mistakes
Watch out
Saying “just store every span”. That is 1.7 PB a day.
Tail sampling without routing by trace_id.
Forgetting async hops. Queues need the context in message headers.
Letting the tracing SDK block the request path when the collector is slow.
Trusting wall clocks across hosts for span order.
13. Summary
A distributed tracing system tags each request with a trace id, propagates it across every hop, and emits timed spans that a backend reassembles into a causal timeline — using sampling to keep the interesting traces affordably.
Concern
Mechanism
What is the data model?
Span = timed unit of work; trace = spans sharing a trace_id, linked by parent_span_id into a tree.
How does one request stay one trace?
Context propagation: inject/extract the trace_id at every hop (W3C traceparent, incl. queues).
Sampling — head (cheap, blind) + tail (buffers trace, keeps errors/slow); usually hybrid.
Where do spans live?
Keyed by trace_id on cheap object storage with a minimal index (Tempo-style).
How is a trace rebuilt?
Read-time assembly: gather spans by trace_id, rebuild the tree from parent links, lay on a timeline.
What aggregate value is there?
Service dependency graph and latency breakdowns from many traces; correlation to logs/metrics.
The recurring theme: propagate a shared id so independent spans can be stitched into one story, and sample intelligently so you keep the traces that matter without drowning in the ones that do not. Everything downstream — storage keyed by trace id, read-time assembly, dependency graphs — follows from those two ideas that Dapper introduced and OpenTelemetry standardized.
14. Check Yourself
What are the four fields of a W3C traceparent header?Answer
Version, trace-id (16 bytes, 32 hex chars), parent span-id (8 bytes, 16 hex chars), and trace flags. The low bit of the flags means “sampled”.
Why can a 1% head sample miss most errors?Answer
The choice is made before the outcome is known. So it keeps 1% of error traces, the same as any other trace.
Tail sampling with a 30 s window at 20 GB/s. How much memory?Answer
20 GB/s × 30 s = 600 GB, spread over the collector fleet.
How does a trace cross a Kafka topic?Answer
The producer injects traceparent into the message headers. The consumer extracts it and starts a span, often linked rather than a child.
Why do spans not need to arrive in order?Answer
Each span carries trace_id and parent_span_id. The read side rebuilds the tree from those links at query time.
Why is a Tempo-style store cheap?Answer
It keeps only a small trace_id index and puts span blocks on object storage. Rich attribute search is harder as a result.
15. Key Terms
Span
A span records one operation with a trace ID, span ID, parent or links, timing, and attributes. Context propagation sends the current trace/span identity across HTTP, RPC, thread, and queue boundaries so related work can be assembled. Example and limits above.
Trace
All spans of one request, as a tree.
Context propagation
Passing trace ids across every call.
traceparent
A span records one operation with a trace ID, span ID, parent or links, timing, and attributes. Context propagation sends the current trace/span identity across HTTP, RPC, thread, and queue boundaries so related work can be assembled. Example and limits above.
Head sampling
Head sampling decides at trace start. Tail sampling buffers received spans and decides after a configured decision interval using observed errors/latency. Sampling reduces retained volume but introduces coverage and bias choices. Example and limits above.
Tail sampling
Head sampling decides at trace start. Tail sampling buffers received spans and decides after a configured decision interval using observed errors/latency. Sampling reduces retained volume but introduces coverage and bias choices. Example and limits above.