A system design interview guide to finding the most frequent items in a massive stream — trending hashtags, top products, hottest search terms — when the universe of items is too large to count exactly and "trending" means recency, not all-time totals.
Student edition · start with the guarantee
Find frequent items while separating approximate frequency error from missing candidate identities.
Correctness contract:CMS overestimation holds for nonnegative insertion-only weight under its hashing assumptions; top-k membership requires a separate candidate-discovery contract.
Basic HTTP, databases, and programming are assumed. Specialized terms are explained below. Named products motivate the problem; this is an educational design, not a claim about their current internals. Capacity numbers are illustrative decimal payload estimates, not benchmarks. Add indexes, protocol overhead, replicas, headroom, and failure capacity before provisioning.
"Show me the top ten trending hashtags" is a question every social product answers, and it hides a genuinely hard counting problem. The stream of items is unbounded and the set of distinct items — hashtags, product ids, search queries — runs into the millions or more, most of them rare. Keeping an exact counter for every item so you can sort and take the top k means a hash map the size of the entire item universe, updated on every event. The way out is to give up exactness for the long tail you do not care about while staying accurate for the heavy hitters you do, using a probabilistic frequency sketch paired with a small heap. This guide builds that design up, then extends it to the recency that makes a count "trending" and to merging results across shards.
Each definition includes a concrete example and the condition under which the mechanism is useful. You can read this guide without opening another guide.
Count-Min Sketch
A matrix of shared frequency counters with one hash-selected cell per row. Increment all selected cells; estimate one item's count using the smallest selected counter. Collisions only add extra counts in an insertion-only, nonnegative stream.
Example. With width ceil(e/ε) and depth ceil(ln(1/δ)), a fixed item's estimate is between its true count and true+ε×total stream weight with probability at least 1−δ, under suitable hashing.
Limit. It cannot enumerate item names or guarantee correct top-k membership. Negative updates, overflow, candidate loss, and repeated/adaptive queries require additional analysis.
Top-k candidate discovery
Frequency estimation and discovering which item IDs to ask about are separate problems. A bounded candidate tracker proposes IDs, then a sketch or exact second pass scores them.
Example. Shard 1 has a=10,x=9; shard 2 has b=10,x=9. Neither local top-1 includes x, but x=18 is the global winner.
Limit. Increasing the local candidate buffer reduces risk but is not a general guarantee. Hash-partitioning each identity to one shard or using a heavy-hitter algorithm with stated bounds changes the analysis.
Time windows
Tumbling windows are fixed, nonoverlapping intervals such as [12:00,12:01). Sliding windows cover a trailing duration and may overlap. Half-open boundaries assign an event exactly once to a tumbling interval.
Example. Two allowed calls at t=0 fall out of a 60-second trailing window at t=60, under the convention (now-60,now]. Fixed calendar buckets instead reset at their boundary.
Limit. A fixed window may allow nearly twice its limit across a boundary. A weighted sliding counter is an approximation; a timestamp log gives an exact count only within its stated clock and admission policy.
Offsets and checkpoints
An offset is a position in one log partition. A checkpoint is a recoverable, consistent record of input positions and processing state. On restart, state must correspond exactly to the input that is considered processed.
Example. If a batch increments a total and crashes before saving its offset, replay increments twice. Commit the total, dedup state, and partition position together, or use a compatible transactional/idempotent sink.
Limit. Saving an offset after a write avoids that specific loss window but can still duplicate; framework checkpoints alone do not make arbitrary external effects transactional.
Cardinality
The number of distinct identities a store must track. A metric series is its metric name plus the full label combination. The product of label-value counts is an upper bound when not every combination occurs.
Example. 100 hosts × 20 routes × 5 status codes can produce up to 10,000 series. Adding a unique request_id can make every request create a new series.
Limit. Hashing every ID to a distinct digest does not reduce cardinality or guarantee anonymity. Use bounded categories, explicit limits, or intentional fixed-bucket aggregation.
1. The Top-K Problem
The Top-K problem is: given a stream of items where the same item appears many times, report the k items with the highest frequency. It sounds like a sorting problem, but the scale changes its character — you cannot afford to keep an exact, sorted tally of a stream that never ends over a universe of items that is enormous and mostly irrelevant.
The applications are the recommendation and discovery surfaces of almost any product:
Trending hashtags or topics — the tags appearing far more than usual right now, surfaced on a discovery page.
Top products — the most-viewed or most-purchased items, for a "popular now" rail or merchandising.
Hottest search queries — the queries spiking in volume, for autosuggest and editorial surfacing.
What makes this its own design topic, distinct from plain distinct-counting, is the shape of the data. Item frequencies follow a heavy-tailed distribution: a handful of items are wildly popular and the overwhelming majority appear only a few times. You only ever care about the head of that distribution — the top k — yet an exact approach is forced to spend memory tracking the entire tail just in case. The whole game is to be accurate about the heavy hitters while refusing to pay for the millions of items that will never come close to the top.
The reframing for an interview: you do not need every item's exact count, you need the identities of the few heaviest items and counts that are close enough to rank them. That asymmetry — caring about the head, not the tail — is what lets a probabilistic sketch replace an exhaustive map.
2. Requirements and Clarifying Questions
Top what, and how many? Search queries, hashtags, products? (Assume search queries, k = 100.)
Over what window? All time, last hour, last day? Sliding or fixed? (Assume last hour and last day, refreshed every minute.)
Exact or approximate? Does the 100th item have to be exactly right? (Assume approximate; order near the top matters most.)
Popular or trending? Highest count, or biggest rise compared with usual? (Start with popular, then extend.)
Global or per region? (Assume global plus per country.)
Functional
Non-functional
Ingest a stream of item events.
Handle about 17,000 events/s at peak, with room to grow 10×.
Return the top k items for a window and region.
Reads in under 50 ms (served from a precomputed list).
Refresh the list continuously.
List freshness about one minute.
Filter blocked or unsafe items.
Bounded memory regardless of how many distinct items appear.
3. Back-of-the-Envelope Estimation
Assume 500 million searches a day, a 3× peak, 100 million distinct queries a day, and about 88 bytes per exact map entry (a ~50-byte string, an 8-byte count, and hash-table overhead).
Step
Working
Result
Events per second (average)
500 M ÷ 86,400
≈ 5,800 /s
Events per second (peak)
5,800 × 3
≈ 17,400 /s
Exact map, one day
100 M distinct × 88 B
≈ 8.8 GB
Events per hour (N)
500 M ÷ 24
≈ 20.8 M
Chosen error
ε = 10−5, so εN
≈ 208 counts
CMS width
⌈e / 10−5⌉
271,829
CMS depth
⌈ln(1/0.01)⌉ for 99% confidence
5
Heap
k = 100 entries (or 1,000 as a local buffer)
a few KB
CMS memory
5 × 271,829 cells × 4 B
≈ 5.4 MB
An hourly top-100 query is typically searched tens of thousands of times, so a worst-case overcount of about 208 barely moves the ranking. The sketch is about 1,600× smaller than the exact map, and it does not grow on a day with twice as many distinct queries.
4. Why Exact Top-K Is Expensive
The exact solution is a hash map from item to count, incremented on every event, with the top k read off by sorting (or maintaining a heap). It is correct, and at small scale it is fine. The cost problem is the size of the map, and it is driven by the long tail rather than the heavy hitters.
Because the map needs an entry for every distinct item that has ever appeared, its memory scales with the size of the item universe, not with k. In a heavy-tailed stream the universe is dominated by rare items — millions of hashtags used once or twice — and you are paying to store a counter for every single one of them, even though none will ever be in the top ten. You are spending almost all of your memory on items the answer will never mention.
At stream scale this map becomes too large to hold in memory on one machine, which forces it into a distributed store and turns every increment into a network operation against hot keys. The exact approach is not wrong; it simply ties memory to the wrong quantity — the breadth of the tail — when the question only concerns the head.
The escape, as with distinct counting, is a tolerance the consumer already has: a trending list does not need exact counts, only the right items in roughly the right order. If item frequencies are estimated with a small, bounded error, the ranking of the heavy hitters is preserved, and the rare items can be allowed to collide and share space because their exact counts never mattered. That tolerance is what the Count-Min Sketch exploits.
5. Count-Min Sketch
A Count-Min Sketch (CMS) is a compact, fixed-size structure that estimates how many times each item has been seen, using far less memory than an exact map by deliberately letting different items share counters. It is the frequency analogue of the bit tricks behind cardinality sketches: trade a little accuracy for a memory footprint that does not grow with the item universe.
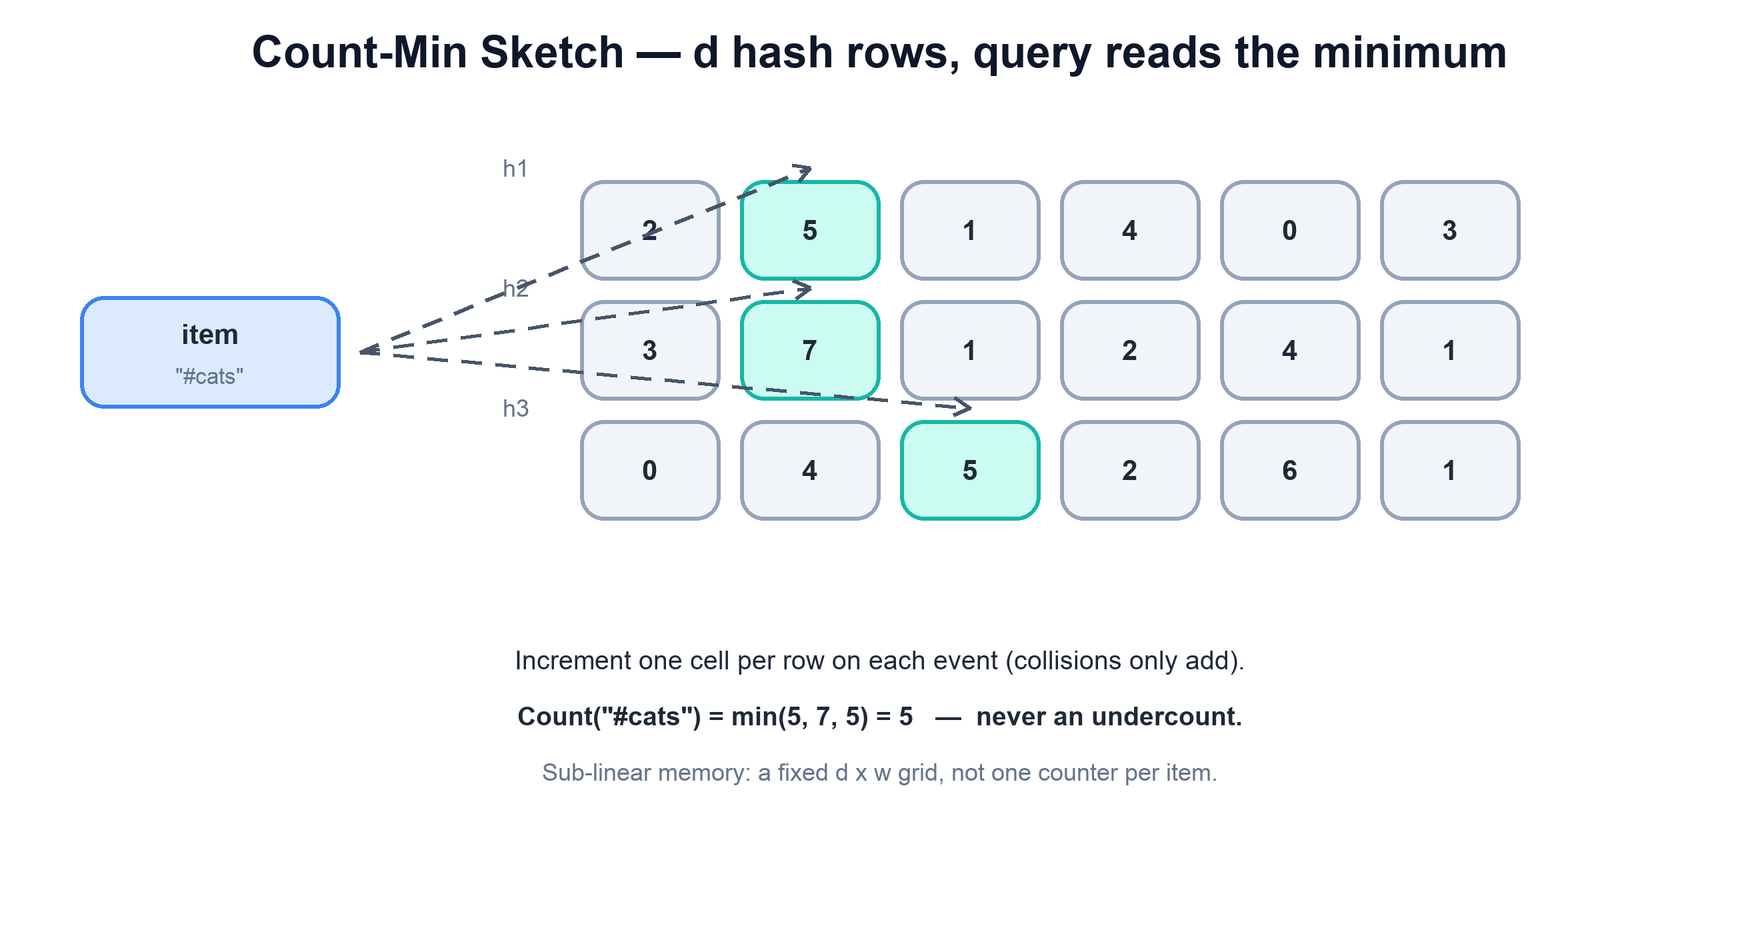
Structurally a CMS is a two-dimensional array of counters: d rows and w columns, with one independent hash function per row. To record an item, you hash it once per row to pick one column in that row and increment all d of those counters. Different items may hash to the same column in some row — a collision — and when they do they share that counter, which is the source of both the memory savings and the error.
An item is hashed by d independent functions, one per row, selecting one cell per row; each event increments those d cells. Because cells are shared across items, a cell may have been inflated by collisions, so the estimated count is the minimum across the item's d cells — the cell least contaminated by other items. The estimate can overshoot but never undershoots.
The clever part is the query. To estimate an item's count you look at its d chosen counters — one per row — and take the minimum. Every one of those counters includes the item's true count plus whatever other items happened to collide with it in that cell, so each counter is an overestimate. The minimum is the least-contaminated of them, the cell where the fewest other items landed. This gives a one-sided guarantee that is exactly what Top-K needs: the estimate is never below the true count, and only ever an overestimate, with the overshoot bounded by the sketch's dimensions.
Every highlighted cell holds the true count plus any collisions, so each one is too high or exact. The minimum picks the cleanest row. Here row 2 had no collision, so the estimate is exact.
The formal bound
Pick an error fraction ε and a failure chance δ. Set w = ⌈e/ε⌉ columns and d = ⌈ln(1/δ)⌉ rows. Then for any item, with probability at least 1 − δ:
true ≤ estimate ≤ true + ε·N
where N is the total number of events in the stream, not the item's own count. With ε = 0.001 and N = 200,000, the overcount is at most 200. That is tiny for an item seen 19,000 times, but it could swamp an item seen 50 times. This is why a CMS ranks heavy hitters well and says little about the tail.
# increment: one cell per row, all d rows
function cms_add(cms, item, count=1):
for r in range(d):
c = hash[r](item) % w # this row's column for the item
cms[r][c] += count # shared cell — collisions just add# query: minimum over the d cells is the least-contaminated estimate
function cms_estimate(cms, item):
return min(cms[r][hash[r](item) % w] for r in range(d)) # never an undercount
The memory win is that the grid is a fixed d × w size chosen for the accuracy you want, completely independent of how many distinct items the stream contains. Adding a millionth rare hashtag costs nothing — it just collides into existing cells — whereas the exact map would allocate a new entry. The structure is sub-linear in the item universe by construction.
A CMS forgets item identities, just like a cardinality sketch, but it remembers approximate frequencies. The minimum-over-rows query and the one-sided "never undercount" guarantee are what make it safe for ranking: a heavy hitter's estimate stays high, and a rare item can be over-reported but never wrongly suppressed. The flip side: an over-reported rare item can sneak into the heap, which is why the counts near the cut-off are the least trustworthy.
6. Pairing CMS with a Heap
A CMS estimates the frequency of any item you ask about, but on its own it cannot tell you which items are the top k — it has thrown away the identities. To produce the actual list you pair the sketch with a small min-heap of size k that remembers the current leading items and their estimated counts.
The heap holds at most k entries and is ordered so that its root is the smallest estimate among the current leaders — the weakest member of the top k, and therefore the one most easily displaced. This is the standard structure for "keep the largest k things seen so far," and keeping it at exactly size k means it costs a tiny, fixed amount of memory regardless of stream length or item universe.
The two structures divide the labour cleanly. The CMS answers "how often has this item been seen?" in fixed memory; the heap answers "is that frequent enough to be in the current top k, and if so who does it bump?" Neither could do the job alone: the sketch lacks identities, and a heap over raw counts would need the exact per-item tallies the sketch is there to avoid.
7. API and Data Model
# write: the search service emits one event per query (async, via Kafka)
{ "item": "world cup final", "ts": "2026-09-25T14:03:07Z", "country": "BR" }

# read: precomputed, served from cache
GET /v1/top?window=1h&country=BR&k=10
  → { "as_of": "2026-09-25T14:03:00Z", "approximate": true,
      "items": [ { "item": "world cup final", "count": 184220 }, … ] }
Structure
Key
Holds
Lives in
Bucket sketch
(region, minute)
CMS grid for one minute
Stream worker memory, checkpointed
Candidate heap
(region, window)
Top 1,000 items and estimates
Stream worker memory
Published list
top:{window}:{region}
Final top k as JSON
Redis / cache, replaced each minute
Raw events
time-partitioned
Every event
Kafka + lake, for exact batch recompute
8. The Streaming Algorithm
Each insertion costs O(d) CMS updates plus the candidate tracker's cost. An indexed heap can update a known candidate in O(log k); scanning a Python list of names and heapifying costs O(k). For fixed small k that may be a reasonable demo, but it is not the same algorithmic bound.
CMS collisions can increase a candidate's estimated count when another item is inserted. Heap scores refreshed only on that candidate's own arrivals can therefore be stale. Re-score the retained candidates before reporting a snapshot and document the tracker as a heuristic unless it has a proved discovery bound. A CMS does not itself retain names or make top-k membership exact.
At a window boundary, sum compatible live-bucket sketches and rebuild scores from a sufficient candidate set. Bucket approximation cannot answer arbitrary partial-bucket windows exactly. Subtracting a whole saved bucket from a matching running grid can be safe algebraically; arbitrary negative updates or rounded decay do not retain the original insertion-only CMS guarantee.
9. Sliding and Decaying Windows
So far the counts are all-time totals, which gives "most popular ever," not "trending." Trending is about recency: an item that is spiking now should rank above one that was huge last year and is now quiet. To capture that, the counting has to forget the past, which means adding a notion of a time window.
Two common approaches express recency:
Sliding / tumbling windows. Maintain separate sketches per time bucket — one per minute or per hour — and compute trending over only the recent buckets, discarding old ones as they age out. A bucket that falls outside the window is simply dropped, so its counts stop contributing. This gives a crisp "last N minutes" view at the cost of keeping several sketches around. A heap cannot subtract an expired bucket, so rebuild it each time a bucket drops: sum the live bucket sketches (or keep a running sum and subtract the expired one — CMS counts are additive), then re-score a candidate set.
Decaying counts. Apply exponential decay so older observations contribute progressively less, either by periodically scaling all counters down by a factor or by weighting increments by recency. A single sketch then reflects a smoothly fading memory of the past, where recent activity dominates without a hard cutoff. When you scale the sketch, scale the estimates stored in the heap by the same factor, or new items will be compared against stale, undecayed leaders and never get in.
A frequent refinement is to define trending as a change in rate rather than raw recent frequency — comparing an item's count in the current window against its typical or previous-window count, so a perennially popular item is not always "trending" and a genuine surge stands out. The windowing machinery is the same; only the ranking signal changes from "how frequent" to "how much more frequent than usual."
All-time Top-K answers "most popular." Windowed or decaying Top-K answers "trending." The structures (CMS plus heap) are unchanged — what changes is that counts must fade, either by dropping old time buckets or by decaying counters, so the ranking reflects now instead of forever.
10. Merging Across Shards
At scale the stream is partitioned across many machines, each maintaining its own CMS and heap over the slice of events it sees. Producing a single global Top-K means combining these per-shard results — and this is where Top-K differs sharply from cardinality sketches, because the merge is only approximate.
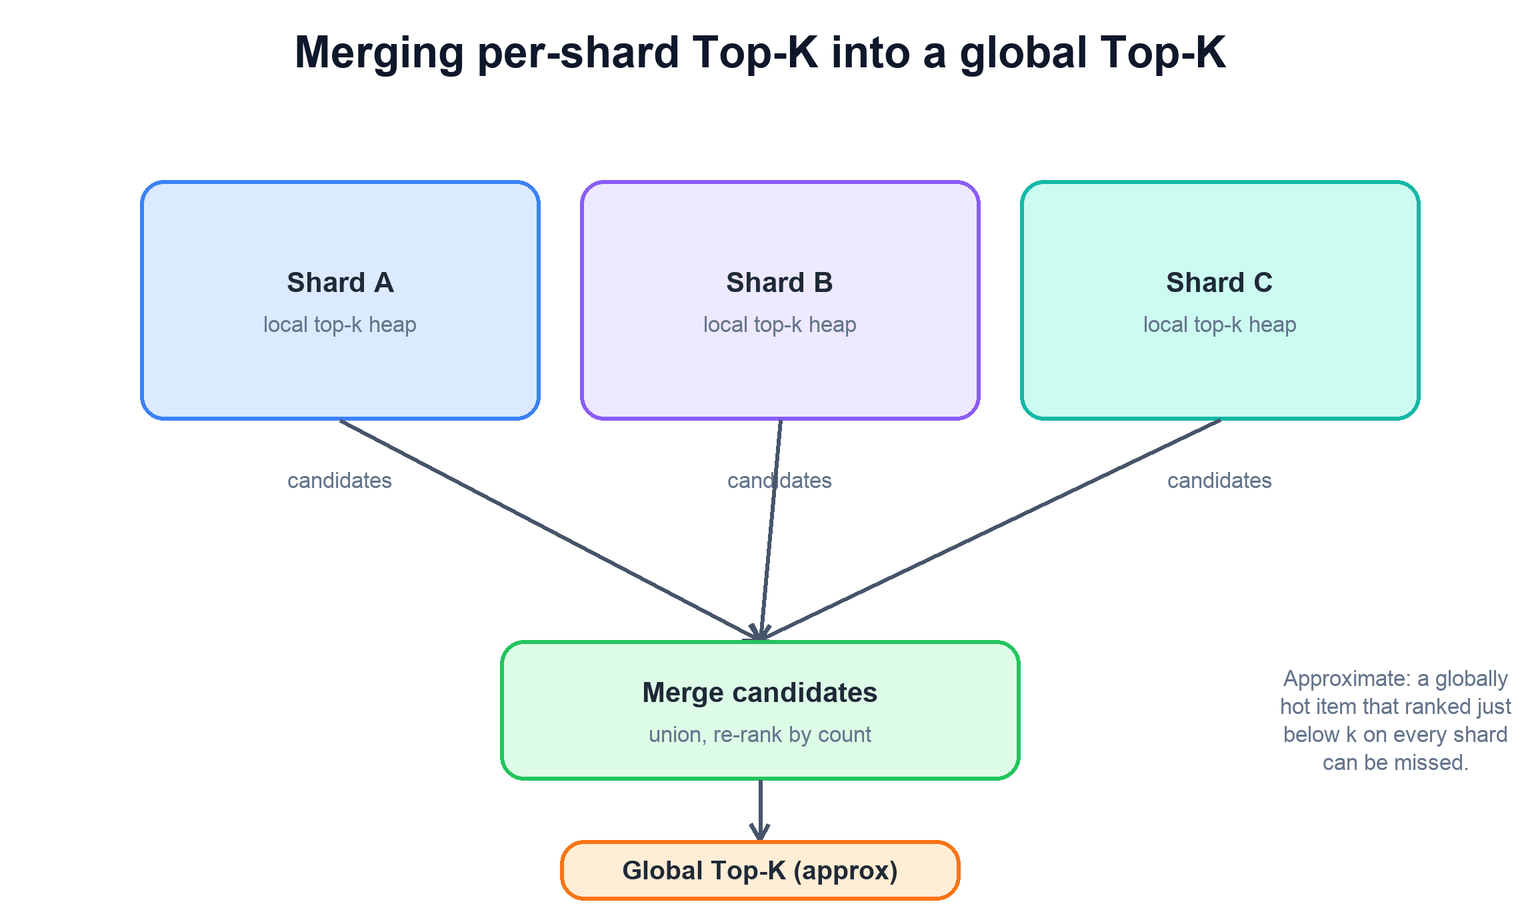
The Count-Min Sketches themselves merge cleanly: same dimensions and hash functions, add the grids cell by cell, and you get a sketch representing the union of all shards' events. The difficulty is the heaps. Each shard's heap only ever tracked the items that were heavy on that shard, so an item that was, say, the eleventh most popular on every shard — never quite making any local top ten — may be genuinely top ten globally yet appear in no shard's heap. Its identity was discarded locally before the merge could see it.
Each shard contributes its local top-k candidates. The merge takes the union of these candidate lists and re-ranks by global count (summing per-shard estimates or querying a merged sketch). The result is approximate: a globally hot item that ranked just below k on every shard contributes no candidate and can be missed entirely.
The practical merge therefore works on candidate sets: take the union of every shard's local top-k items, then re-rank that combined candidate list by global frequency — either by summing each candidate's per-shard estimates or by querying a merged sketch. To reduce the miss-an-item risk, shards usually track more than k locally (a top-2k or top-10k buffer), so an item that is moderately strong everywhere is more likely to survive into some shard's candidate list and reach the merge.
function global_top_k(shards, K):
  candidates = union(s.heap.items() for s in shards)   # local leaders only
  merged_cms = reduce(cms_merge, [s.cms for s in shards])
  scored = [(item, cms_estimate(merged_cms, item)) for item in candidates]
  return top_k_by_count(scored, K)                     # approximate — tail items can be missed
11. Accuracy Tradeoffs
There are at least two errors: estimated frequency may be inflated by hash collisions, and a true winner's identity may be missing from the candidate set. Larger width/depth reduces sketch error; larger candidate buffers mitigate discovery risk but do not prove arbitrary exact top-k recovery.
With width ceil(e/ε) and depth ceil(ln(1/δ)), a fixed item's estimate has an additive ε×total-weight upper bound with probability at least 1−δ under suitable independent hashing. This is not a guarantee that all adaptive queries always satisfy the bound; use an appropriate union bound or stronger analysis when reporting many items. Relative error is most relevant near the cutoff, where rankings are fragile.
Use the downloaded model to test the local-top-k counterexample and the non-underestimation invariant. For a production heavy-hitter contract, evaluate Space-Saving or Misra–Gries with stated bounds, retain more candidates, or do exact refinement from the replayable stream. Report frequency bounds and membership coverage separately.
12. Failure Modes
Failure
What happens
Mitigation
Worker crashes
In-memory sketch and heap lost.
Checkpoint sketch + heap + Kafka offset together; replay from the offset.
Replay after crash without checkpoint
Events counted twice.
CMS adds are not idempotent (unlike HLL); restore state and offset atomically.
One item floods one partition
That worker lags.
Partition by random or event id, not by item; every worker keeps a partial sketch and they are summed.
Bots spam a query
Junk reaches the list.
Filter or rate-limit per user before counting; blocklist at publish time.
Merge misses a globally hot item
Item absent from the list.
Keep a larger local buffer (e.g. 10k) per shard; periodic exact batch job to audit.
Publisher down
List goes stale.
Serve the last list with its as_of; readers never compute on demand.
13. Tradeoffs and Alternatives
Approach
Memory
Guarantee
Use when
Exact hash map + heap
Grows with distinct items
Exact
Distinct items fit in memory, or in a batch job.
Count-Min Sketch + heap
Fixed d × w
Overcount ≤ εN w.p. 1−δ
Need frequencies of any item, and mergeable sketches.
Count Sketch (Charikar et al.)
Fixed
Unbiased, error tied to the L2 norm
Very skewed data where two-sided error is fine.
Misra-Gries
k−1 counters
Undercount ≤ N/k; finds all items with frequency > N/k
Deterministic heavy hitters with tiny memory.
Space-Saving (Metwally et al.)
m counters
Overcount ≤ N/m; tracks identities directly
Top-k with no separate heap; widely used in practice.
Batch (MapReduce / SQL)
Disk
Exact
Daily lists, audits, or checking the streaming answer.
Worked example: a global winner missing from local top-1 lists
There are two shards, each keeping only its locally most frequent item.
Read top to bottom. The table below explains the state and guarantee at each step.
Step
State, calculation, and reasoning
1. Count shard 1
a=10 and x=9. Its local top-1 is a, so x's identity is dropped.
2. Count shard 2
b=10 and x=9. Its local top-1 is b; x is again dropped.
3. Merge local candidates
The candidate union is {a,b}. Even a perfectly merged sketch cannot score x if nobody retained its identity.
4. Compute the real answer
Globally x=18 while a=b=10, so x is the true top-1. Track a larger bounded candidate set, use a proven heavy-hitter algorithm, or use an exact second pass when the requirement demands it.
Check your understanding: Does a one-sided count overestimate guarantee the right ranking?
No. Collision inflation can reorder near-ties, and candidate loss can hide a winner entirely. State count and membership error separately.
Run a small, testable model
Download concepts.py. It uses only the Python 3.10+ standard library. From the directory where you saved it, run:
python3 concepts.py topk
python3 concepts.py test
The model constructs this counterexample and verifies both exact counts and the missing candidate; it also tests CMS non-underestimation.
The program contains deterministic assertions and failure traces. It is a learning model, not a production service: it does not implement network consensus, distributed durability, authentication, or third-party delivery. Read its contracts and try changing an input before extending it.
Hash map + heap; why it fails at scale; batch as the exact fallback.
15–30
CMS + heap
Grid, min over rows, εN bound, streaming update, heap eviction.
30–40
Windows and scale
Minute buckets, decay, sharding, merging sketches and candidates.
40–45
Wrap up
Serving from cache, spam filtering, failures, trending as rate change.
15. Common Mistakes
Thinking CMS error is relative to the item. The bound is ε times the whole stream, N.
Taking the average of the d cells. Every cell is an overcount; the minimum is the right estimate.
Merging heaps by adding their counts. Items missing from a shard's heap are not zero there. Re-score candidates against a merged sketch.
Decaying the sketch but not the heap. Stale leaders then block new items.
Partitioning by item. A viral item overloads one worker. Partition randomly and merge.
Computing the top-k on each read. Precompute and cache it; reads should be a key lookup.
16. Summary
A trending Top-K system finds the heaviest items in an unbounded stream without paying for the long tail. The design is a few interlocking decisions:
Concern
Mechanism
What are we computing?
The k most frequent items in a stream — trending hashtags, top products, hottest queries.
Why not an exact counter map?
It needs an entry per distinct item, so memory scales with the (mostly irrelevant) item universe, not with k.
How do we estimate counts cheaply?
Count-Min Sketch: a d×w counter grid, increment one cell per row, query the minimum — a bounded overestimate in fixed memory.
How do we get the actual top-k items?
Pair the sketch with a size-k min-heap that tracks the current leaders by estimated count.
How does each event flow?
Increment the CMS, read the estimate, compare to the heap minimum, update the heap if it beats the weakest leader.
How do we make it "trending"?
Sliding/tumbling windows or decaying counts so recent activity outranks stale all-time totals.
How do we go global across shards?
Merge the sketches cell-wise and union the per-shard candidate lists, then re-rank — an approximate merge.
How accurate is it?
CMS only overcounts and is tunable via d and w; errors concentrate on the rare tail, leaving heavy hitters accurate.
The recurring theme: be exact where it matters and approximate where it does not. The heavy hitters you report stay accurate because they dominate their counters; the millions of rare items you ignore are allowed to collide and blur. Top-K at scale is the art of spending precision only on the head of the distribution.
17. Check Yourself
You want overcounts of at most 0.1% of the stream with 99% confidence. What are w and d?
Answer
w = ⌈e/0.001⌉ = 2,719 and d = ⌈ln(100)⌉ = 5, so 13,595 counters. With 4-byte counters that is about 54 KB.
An item's cells hold 12, 15, and 9. What is its estimate, and what do you know about its true count?
Answer
The estimate is 9, the minimum. The true count is at most 9 (every cell is ≥ true), and with probability 1−δ it is at least 9 − εN.
Why can a Count-Min Sketch overcount but never undercount?
Answer
Each cell holds the item's own count plus counts of any items that collided there. Collisions only add, so every cell, and therefore the minimum, is ≥ the true count.
Two shards each keep a top-10 heap. Why can the merged top 10 be wrong?
Answer
An item ranked 11th on every shard appears in no heap, yet its global total may be top 10. Track a larger local buffer and re-score the union of candidates against a merged sketch.
You decay all sketch counters by half every hour but forget the heap. What goes wrong?
Answer
The heap's stored estimates stay at the old, larger values. New items, measured with decayed counts, rarely beat the heap minimum, so the list freezes on old leaders.
With N = 20.8 M events per hour and ε = 10−5, is the sketch accurate enough to rank an item seen 30,000 times? One seen 150 times?
Answer
The worst overcount is about 208. For 30,000 that is under 1%, so ranking is fine. For 150 the error can exceed the count itself, so the sketch cannot rank it.
18. Key Terms
Heavy hitter
An item whose frequency is a large share of the stream.
Count-Min Sketch
A matrix of shared frequency counters with one hash-selected cell per row. Increment all selected cells; estimate one item's count using the smallest selected counter. Collisions only add extra counts in an insertion-only, nonnegative stream. Example and limits above.
ε, δ
Error fraction of N and failure probability; set w and d.
N
Total number of events added to the sketch.
Min-heap
A tree whose root is the smallest element; keeps the current top k.
Tumbling window
Fixed, non-overlapping time buckets (e.g. each minute).
Sliding window
The last T time units, advanced as time moves on.
Exponential decay
Scaling old counts down so recent events weigh more.
Space-Saving
A heavy-hitters algorithm with m counters that replaces the minimum.
Misra-Gries
A deterministic heavy-hitters algorithm with k−1 counters.
Further reading
Graham Cormode and S. Muthukrishnan, "An Improved Data Stream Summary: The Count-Min Sketch and its Applications," Journal of Algorithms, 2005.
Ahmed Metwally, Divyakant Agrawal, Amr El Abbadi, "Efficient Computation of Frequent and Top-k Elements in Data Streams," ICDT 2005 (Space-Saving).
Jayadev Misra and David Gries, "Finding Repeated Elements," Science of Computer Programming, 1982.
Moses Charikar, Kevin Chen, Martin Farach-Colton, "Finding Frequent Items in Data Streams," ICALP 2002 (Count Sketch).