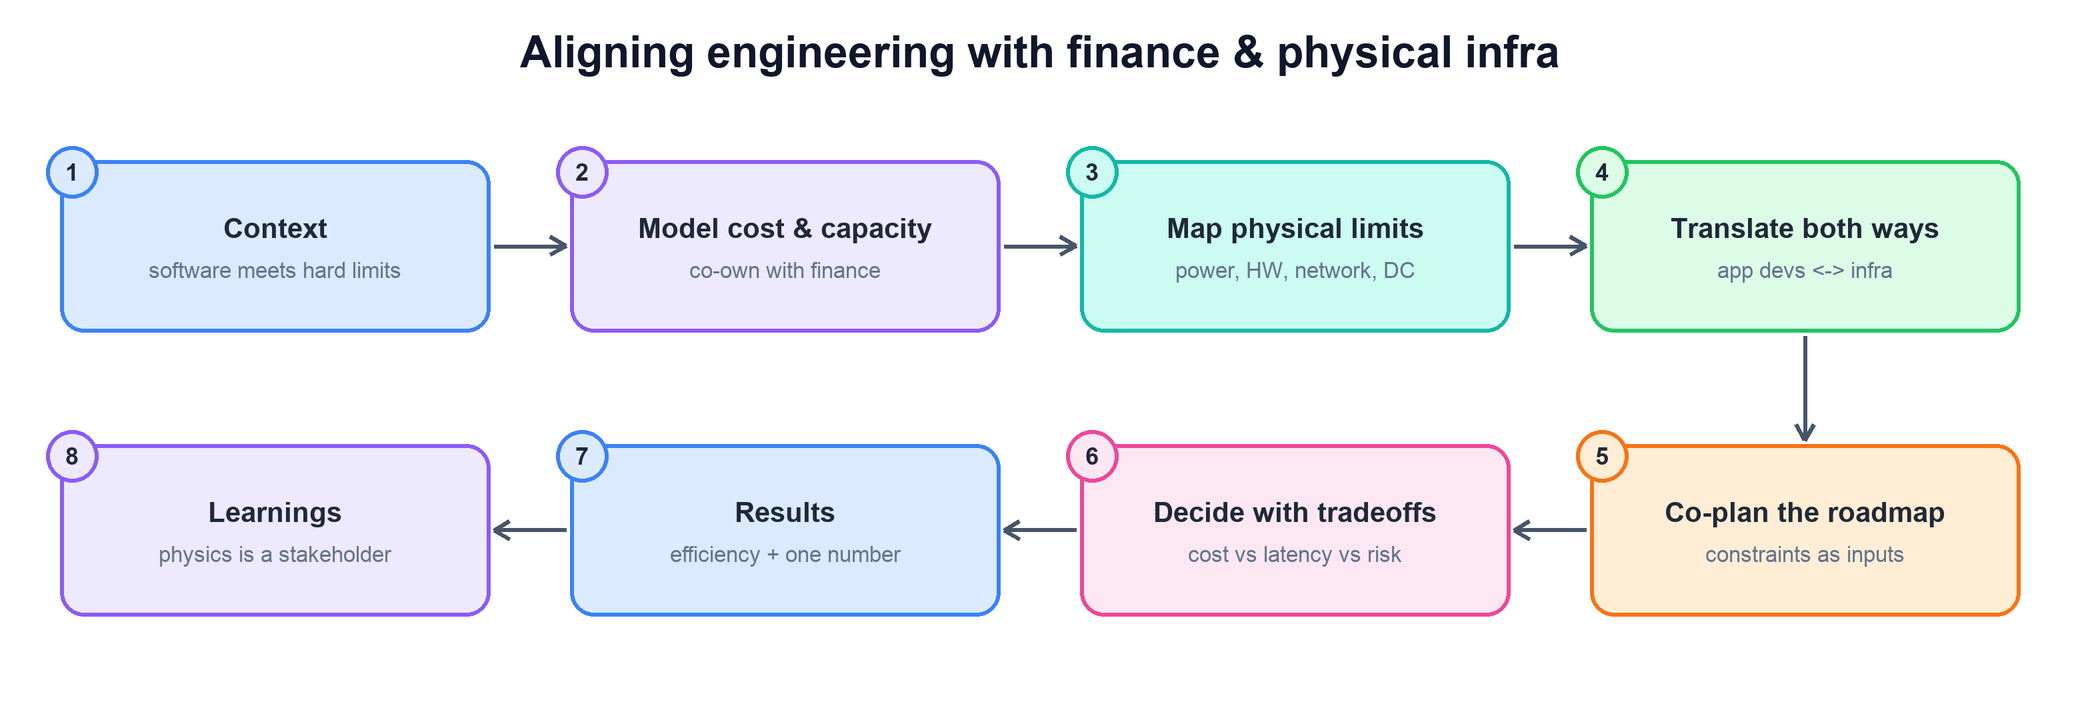
Aligning Engineering with Finance & Physical Infra
Bridging software with the non-engineering constraints that actually bound it — budget, capacity, power, and hardware.
Student edition · understand, apply, verify
Connect software demand to physical capacity, budgets, lead times, and failure headroom.
What you should be able to do: State demand uncertainty and survivor capacity before promising availability or a delivery date.
Context-dependent collaboration guidance. Examples/numbers are illustrative; first-person practice drafts are not verified personal history. Respect decision rights, safety/legal obligations, privacy, and the partners' actual capacity. No framework guarantees agreement or delivery.
Concepts explained in this guide
Read these definitions first, or use the linked terms as you go. The examples and limitations are local to this guide; companion pages are optional.
Forecast percentiles and headroom
A forecast predicts future demand with uncertainty; P50 is a median, not necessarily a mean, and P90 is a quantile under the chosen model. Provision usable surviving capacity above a calibrated demand target.
Example. 6000 units growing 3% per month exceed 7500 usable units after log(7500/6000)/log(1.03)≈7.55 months. A 3.5-month procurement runway means order in about 4.05 months.
Boundary. P90 does not mean a 90% chance of never exhausting capacity over the whole horizon. Per-service P90s do not generally add; model correlations, censored demand, lead time, and capacity granularity.
Failure domains and redundant capacity
A failure domain is a set of components vulnerable to one shared event: process, host, rack, zone, or region. Redundancy must separate domains and leave enough surviving capacity to carry peak demand.
Example. Five replicas placed 2/2/1 across three regions leave at least three after any one region fails. A 3/1/1 layout can lose its quorum with the largest region.
Boundary. Independent-failure probability formulas are illustrative assumptions. Shared code/config, dependencies, routing, and control planes can fail all replicas together. N+1 machines does not imply tolerance of a whole zone.
Opportunity cost and prioritization
Opportunity cost is benefit forgone by choosing one investment over another. Compare expected value, effort, uncertainty, constraints, and dependencies under finite capacity.
Example. A feature can delay reliability work; compare user benefit with risk reduction and explain the choice.
Boundary. ROI/RICE/weighted scoring are aids, not exact laws. Units, uncertainty, mandatory constraints, and critical paths can dominate scores.
Outputs, outcomes, and measurement
Outputs are produced things; outcomes are changes for users/business/team. Useful metrics state definition, denominator, population, period, and attribution limits.
Example. 'Shipped a tool' is output. 'Median onboarding fell ten to six days in this cohort' is an outcome with sample/context caveats.
Boundary. Before/after does not prove sole causation. Avoid gaming, selection bias, hidden costs, and unlike-team comparisons.
Stakeholders and alignment
A stakeholder is affected by or able to affect a decision. Alignment means understanding goals, constraints, tradeoffs, and the decision process; it does not require unanimous agreement.
Example. Finance values cost predictability, customers migration effort, and operations safe recovery. State these criteria before choosing.
Boundary. Consultation is not an unlimited veto. Name decision authority, required evidence, deadline, and escalation.
This question tests whether you understand that at scale, engineering decisions are bounded by things software engineers rarely think about: a finance capacity budget, the power draw of a datacenter row, hardware lead times, and network peering limits. A senior infra leader has to partner with finance on cost and capacity modeling and with physical-infra and datacenter teams on the hard limits — and then translate between application developers and physical reality so each side’s constraints show up in the other’s plans. The interviewer wants to see fluency across that boundary, not just clean code. The answer follows the CARL shape.
The spine: model cost and capacity with finance → map the physical limits (power, hardware, network, DC) → translate both ways between app devs and infra → co-plan the roadmap with constraints as inputs.
What this question is really testing
Can you operate at the seam where software meets money and physics — speaking finance’s language on cost and capacity, respecting the datacenter’s hard limits, and translating both so application teams design within reality instead of colliding with it?
How to answer
Model cost and capacity with finance, not around them. Build a capacity model that ties engineering demand (events per second, bytes stored, CPU) to dollars and to a forward-looking budget, and co-own it with finance so capacity planning is a shared, quantified conversation rather than a surprise at quarter-end.
Map the physical limits. Know what actually bounds you — power and cooling per rack, server and NIC lead times measured in months, network and peering capacity, datacenter floor space. These are hard constraints that no amount of clever code removes; treat them as first-class inputs.
Translate in both directions. To application developers, turn “we’re out of power in that region” into “here’s the efficiency target your service needs to hit.” To physical-infra and finance, turn product growth curves into demand forecasts they can provision against. Being the bilingual person at that seam is the whole job.
Bring constraints into the roadmap early. Feed the physical and financial limits into design and planning up front, so teams choose an architecture that fits the power, hardware, and budget envelope — instead of designing freely and discovering at launch that the capacity doesn’t exist and can’t be bought in time.
Decide with the full tradeoff. Make the calls explicitly across cost, latency, reliability, and lead time — e.g. accept slightly higher latency to fit a power budget, or pre-buy hardware to hedge a forecast — and show your reasoning so partners trust the decision.
What the interviewer is looking for
Comfort with cost and capacity modeling — fluency in finance’s language, not just latency.
Awareness that physical limits (power, hardware lead time, network) are real and binding.
The translator skill — connecting application design to physical and financial reality both ways.
Constraints treated as design inputs, surfaced early, not discovered at launch.
Explicit, defensible tradeoffs across cost, performance, reliability, and time.
A worked example (CARL)
Practice draft: first-person narratives below are not independently verified autobiographical evidence. Use their structure, not their claimed results; replace with your genuine safe-to-share experience.
Context. Our ads events volume was forecast to grow sharply over the next year, and the naive plan was to scale our storage footprint linearly with it. When I actually modeled that against reality with the capacity and datacenter teams, it didn’t fit: the region we were growing in was projected to hit a power ceiling before the end of the year, the incremental servers we’d need had a multi-month hardware lead time, and finance’s budget for the tier couldn’t absorb a linear cost increase. Three separate non-engineering constraints — power, hardware lead time, and budget — all said the same thing: we couldn’t just buy our way out.
Actions. I treated this as a translation and modeling problem, not just an efficiency sprint. First I built a shared capacity model with finance and the capacity team that tied our engineering demand curve — events/sec and bytes stored — directly to server count, power draw, and dollars, so all three organizations were finally looking at one set of numbers instead of arguing from three. That model made the collision concrete: it showed the exact month we’d hit the power ceiling and the budget line. Then I did the two-way translation. To the application and product teams generating the events, I converted “the region runs out of power in Q3” into a concrete, actionable target: a per-event storage-efficiency goal, because I’d shown that if we cut bytes-per-event enough, the same power and budget envelope could hold the growth. To finance and the datacenter team, I converted the product growth forecast into a demand forecast they could plan capacity and hardware orders against, with enough lead time to actually order servers. On the engineering side, my team drove the efficiency work the model pointed at — tiering colder data to cheaper storage and adopting a more efficient encoding — and I sequenced it against the physical timeline: hit the efficiency target before the power ceiling, and place the hardware order early enough to clear the lead time. Where there were genuine tradeoffs — the colder tier added read latency for old data — I made them explicit with the consumer teams and got agreement that the latency hit on cold reads was acceptable in exchange for staying within the power and budget envelope.
Results. We absorbed the full forecast growth without exceeding the region’s power budget and without the linear cost increase — the efficiency work cut per-event storage cost by roughly 40%, which kept us inside finance’s budget line. Because the demand forecast reached the datacenter team early, the hardware we did need was ordered ahead of the lead time and arrived before we were blocked. No capacity fire drill, no emergency budget ask.
Learnings. At scale, physics and finance are stakeholders as real as any product team — power ceilings and hardware lead times don’t negotiate. The highest-leverage thing I did was build one shared model that let engineering, finance, and datacenter teams reason from the same numbers, and then translate the constraint into an engineering target the app teams could actually act on. Bridging that seam is where an infra leader creates disproportionate value.
Common follow-ups
How do you talk about cost and capacity with finance partners?
How to answer
Speak in dollars and forecasts. Tie engineering demand to a cost model and a forward budget, not to latency graphs.
Build one shared model. A single source of truth ends the three-teams-three-numbers argument.
Give them predictability. Finance values a reliable forecast over an optimistic one — flag uncertainty explicitly.
Frame efficiency as ROI. Show cost per unit of business value, so efficiency work reads as a return, not a chore.
How do physical constraints like power or hardware lead time change your design?
How to answer
Treat them as hard inputs. Power ceilings and lead times bound the design space before you start, not after.
Design for efficiency when capacity is capped. If you can’t add power, you cut demand per unit — efficiency becomes the lever.
Plan against lead time. Forecast and order early; hardware you need in Q3 is decided in Q1.
Consider placement. Region and datacenter choice is an engineering decision when power and network differ by site.
App developers just want their feature shipped and don’t care about infra limits. How do you align them?
How to answer
Translate the limit into their terms. Give them a concrete efficiency or budget target, not a lecture on datacenters.
Make the constraint visible early. Surface it in design review so it shapes the architecture, not the launch.
Show the shared stakes. A launch that can’t get capacity doesn’t ship — the limit is their problem too.
Offer the easy path. Provide efficient defaults and tooling so hitting the target is low-effort for them.
Evidence to collect with your approved tools
A decision/review record with the problem, constraints, options, and your contribution.
Relevant tests, dashboards, or measurements with definitions, denominators, dates, and uncertainty.
Incident or delivery records showing actual outcomes and unresolved limitations.
Stakeholder agreements and follow-up actions with owners and review dates.
Only authorized, minimized, safe-to-share evidence. Do not copy confidential personnel notes into a public story.
Worked example: hardware takes three months to arrive
Use the following scenario to practice making goals, uncertainty, responsibility, and evidence explicit.
Sequence for this example. The table explains the evidence and decision at each step.
Step
Evidence, decision, and expected result
Forecast unconstrained demand
Use arrivals/rejections/backlog, not a utilization graph capped at 100%.
Calculate usable survivors
Subtract specified failed-domain and maintenance capacity, safe utilization, and forecast uncertainty.
Account for procurement
Order before projected usable-capacity crossing minus lead/install margin; use discrete units and qualified cost assumptions.
Choose the tradeoff openly
Compare efficiency, phased launch, alternative placement, and capacity purchase, retaining user/service commitments.
Check your understanding: Can per-service P90s be added as an exact fleet P90?
Not generally. Aggregate quantiles depend on correlations; model or forecast the aggregate explicitly.
Practice with your own situation
Choose a real cross-team decision. Record the shared problem, each party's constraints, options, assumptions, authority, agreed actions, owner/date, observed outcome, and reconsideration trigger. Use authorized evidence and distinguish contribution from attribution.
Use genuine, safe-to-share evidence. Example numbers here illustrate reasoning; they are not claims about your work or a guaranteed outcome.