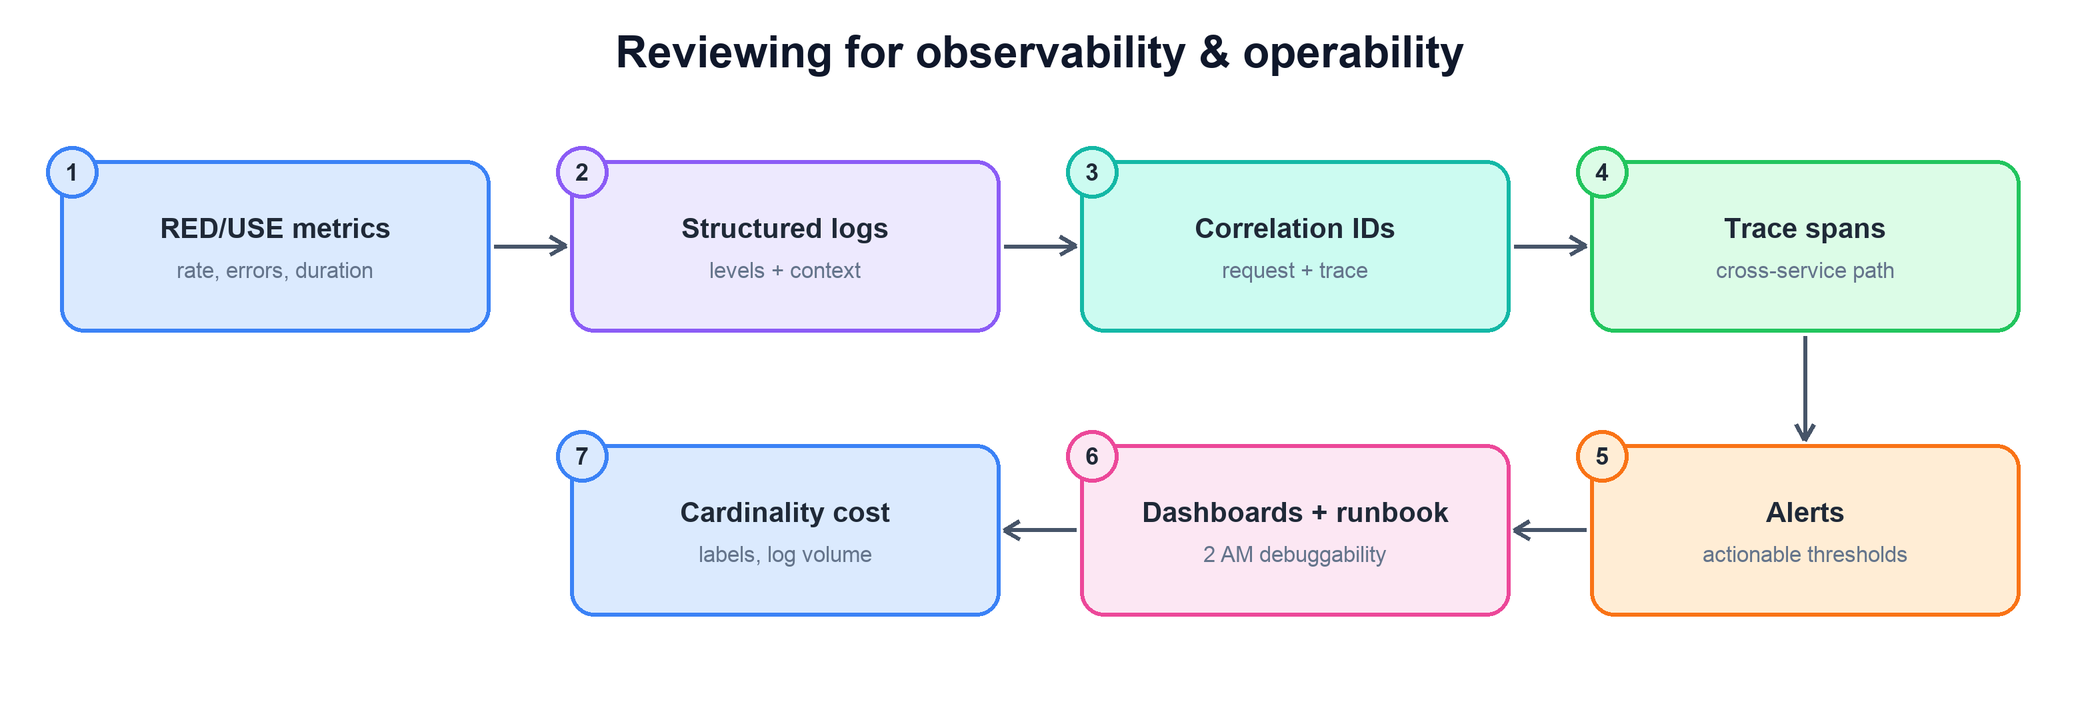
The real test of a diff: can the on-call who has never seen this code debug it at 2 AM with only the dashboards?
Student edition · understand, apply, verify
Review whether a new behavior can be detected and explained without unsafe or excessive telemetry.
What you should be able to do: Define user-facing outcomes and diagnostic signals with bounded cardinality, coverage, and actionable alert policy.
A context-dependent practice guide, not a universal policy or verified personal history. Examples and numbers are illustrative. Use genuine, authorized evidence; personnel/privacy/legal decisions follow applicable organization policies and qualified review.
Concepts explained in this guide
Read these definitions first, or use the linked terms as you go. The examples and limitations are local to this guide; companion pages are optional.
SLIs, SLOs, and error budgets
An SLI measures a user-relevant outcome; an SLO sets its target over a window. For a success-ratio SLO, the allowed bad fraction is 1−SLO. An SLA is a contractual commitment that may use different definitions.
Example. 99.9% successful requests over 1 billion requests allows 1 million bad requests. A time-based 30-day availability target instead allows 43.2 unavailable minutes.
Boundary. Request and time budgets are not interchangeable under variable traffic or partial failure. SLOs are not universally stricter than SLAs; choose both from their definitions and user needs.
Burn-rate alerting
Burn rate is the observed bad-event fraction divided by the allowed bad fraction. Multi-window alerts require sustained long-window burn and a confirming short window so old incidents can clear.
Example. For a 99.9% SLO, 2% errors is 20× burn. In a 30-day window, 14.4× time-normalized burn for one hour consumes 14.4/720=2% of budget.
Boundary. That conversion assumes time-based measurement or roughly representative request volume. Low traffic, missing telemetry, and denominator-zero need policy; an alert alone does not guarantee response.
Cardinality
The number of distinct identities a store must track. A metric series is its metric name plus the full label combination. The product of label-value counts is an upper bound when not every combination occurs.
Example. 100 hosts × 20 routes × 5 status codes can produce up to 10,000 series. Adding a unique request_id can make every request create a new series.
Boundary. Hashing every ID to a distinct digest does not reduce cardinality or guarantee anonymity. Use bounded categories, explicit limits, or intentional fixed-bucket aggregation.
Spans and trace context
A span records one operation with a trace ID, span ID, parent or links, timing, and attributes. Context propagation sends the current trace/span identity across HTTP, RPC, thread, and queue boundaries so related work can be assembled.
Example. A gateway starts a trace, injects W3C traceparent into a service call, and the service links its queue consumer work to the producer span.
Boundary. Cross-host wall clocks can skew timelines. A parent-child graph is not always a tree because asynchronous work can have multiple links. Instrumentation must be configured; IDs are not automatically present in every log.
Outputs, outcomes, and measurement
Outputs are produced things; outcomes are changes for users/business/team. Useful metrics state definition, denominator, population, period, and attribution limits.
Example. 'Shipped a tool' is output. 'Median onboarding fell ten to six days in this cohort' is an outcome with sample/context caveats.
Boundary. Before/after does not prove sole causation. Avoid gaming, selection bias, hidden costs, and unlike-team comparisons.
Code that works but can't be observed is a future outage with no flashlight. This question tests whether you review changes for their operational life — not just “is it correct” but “when it breaks, will we know, and will we be able to find out why fast.” For someone from storage and events infra, where you've carried the pager, this should be a strength. A new code path with no metric, a failure that logs nothing, an alert that pages on a symptom no one can act on — these are the things a senior reviewer catches before they become a 3 AM mystery.
The operability lens: RED/USE metrics on new paths, structured logs at the right level, correlation/request IDs, trace spans, actionable alerts, dashboards and a runbook — and control the cardinality cost of it all.
What this question is really testing
Whether you own the 2 AM debuggability of code you approve. The signal is that you treat instrumentation as part of the feature, not an afterthought, and that you know the vocabulary — RED/USE, structured logging, correlation IDs, traces, actionable alerting — and the cost model behind it. It also tests judgment: more telemetry isn't automatically better; high-cardinality metrics and chatty logs have a real bill and can bury the signal.
How to answer
Metrics on every new path (RED/USE). RED for request-driven services — Rate, Errors, Duration. USE for resources — Utilization, Saturation, Errors. A new endpoint, consumer, or failure branch that emits no counter or latency histogram is invisible; ask for it.
Structured logs at the right level. Logs should be key-value, not string-concatenated prose, so they're queryable. Check log levels — errors at ERROR, not INFO; no per-event logging at INFO on the hot path (that's a cost and noise bomb). Every error path should say something actionable.
Correlation and request IDs. A request/trace ID must propagate through logs and across service boundaries so you can stitch one request's story together. A log line with no correlation key is nearly useless in a distributed system.
Trace spans. For multi-hop paths, look for spans around the meaningful operations (RPCs, DB calls, queue hops) so latency can be attributed to the right stage. A new remote call with no span is a blind spot in the trace.
Actionable alert thresholds. Alerts should fire on symptoms users feel (error rate, latency SLO burn), be actionable, and point to a runbook. Reject alerts that page on causes no one can act on, or thresholds tuned to flap — alert fatigue is a reliability risk itself.
Dashboards and runbooks. A significant new feature or failure mode should come with (or update) a dashboard and a runbook step. The reviewer's question: if this pages, does the on-call have a graph to look at and a documented next action?
The 2 AM test. Read the diff as the on-call who didn't write it. Can they tell what broke, where, and why, from telemetry alone? If the answer is “only the author could debug this,” the observability is incomplete.
Cardinality and cost. Metric labels and log keys built from unbounded values (user ID, URL, request ID as a metric label) explode cardinality and cost. Push high-cardinality identifiers into logs/traces, keep metric labels bounded, and sample high-volume logs.
What the interviewer is looking for
Instrumentation treated as part of the change, not a follow-up.
Fluency with RED/USE, structured logging, correlation IDs, and tracing.
The “can an on-call debug this at 2 AM” framing applied concretely.
Alerts judged for actionability and anti-flap, not just presence.
Cost awareness — cardinality and log volume as real constraints, more isn't always better.
Concrete example — the invisible failure branch. A diff adds a fallback path: if the primary dimension store times out, the code silently emits the event un-enriched. Functionally reasonable. But there's no counter on the fallback, the timeout is caught and logged at DEBUG, and the enrichment latency isn't measured. In production, the primary store degrades, 30% of events quietly go un-enriched, downstream revenue attribution drifts — and every dashboard is green because nothing is instrumented. The reviewer's asks: a counter on the fallback branch, a latency histogram on the enrichment call, an ERROR-or-WARN log with the campaign/request ID, and an alert when the fallback rate crosses a threshold. Now the same degradation pages in minutes with a clear cause.
Common follow-ups
How do you tell good instrumentation from noise?
How to answer
Tie every signal to a question. A metric or log should answer “is it healthy?” or “why did it break?” If it answers neither, cut it.
Levels and sampling. Reserve ERROR/WARN for actionable events; sample high-volume INFO/DEBUG on the hot path.
Bounded labels. Keep metric dimensions low-cardinality; push detail into logs/traces.
What makes an alert good vs bad?
How to answer
Symptom-based and actionable. Page on user-visible pain (SLO burn), not on a raw cause no one can fix at 2 AM.
Runbook-linked. Every page should point to a documented next step.
Anti-flap. Thresholds and durations tuned so it doesn't cry wolf — alert fatigue erodes response.
The team says instrumentation can be a follow-up diff. Agree?
How to answer
For risky paths, no. If it can page, it ships with observability — a follow-up that never lands is the default outcome.
Right-size it. A trivial internal change doesn't need a dashboard; a new production path does.
Make it a checklist item. Encode “new path -> metric + log + alert” so it isn't per-reviewer memory.
How do you review the cost of observability?
How to answer
Cardinality first. Unbounded metric labels are the top cost driver; flag IDs used as labels.
Log volume and retention. Per-event logging at INFO on a hot path is a budget and signal-to-noise problem; sample it.
Keep observed eligible error/slow traces under a documented collector policy; head drops, late spans, buffer eviction, and outages still limit coverage.
Evidence to collect with your approved tools
A decision/review record with the problem, constraints, options, and your contribution.
Relevant tests, dashboards, or measurements with definitions, denominators, dates, and uncertainty.
Incident or delivery records showing actual outcomes and unresolved limitations.
Stakeholder agreements and follow-up actions with owners and review dates.
Only authorized, minimized, safe-to-share evidence. Do not copy confidential personnel notes into a public story.
Worked example: an invisible fallback rate
This is an illustrative situation. The point is the reasoning and evidence, not copying the numbers or first-person story.
Sequence for this example. The table explains the evidence and decision at each step.
Step
Evidence, decision, and expected result
State fallback behavior
A dependency timeout emits incomplete events; decide whether that is allowed for the consumer.
Measure numerator and denominator
Count incomplete and all eligible events, with latency and coverage/missing-data indicators.
Keep dimensions bounded
Use service/route/outcome labels; request IDs belong in authorized sampled logs/traces, not unbounded metric labels.
Alert on meaningful risk
Tie thresholds/burn windows to user impact and enough observations. Sampling and trace retention do not guarantee every error is visible.
Check your understanding: Can tail sampling recover errors discarded at the head stage?
No. Tail only evaluates spans that actually reached its bounded collector state.
Run and change the example
Download guide_labs.py. Python 3.10+, standard library only. In its directory, run:
python3 guide_labs.py metrics
python3 guide_labs.py test
The lab demonstrates denominator and no-data policies. Production alert and trace coverage must be validated separately.
The program tests its stated finite contracts. It is an educational model, not an implementation of the named production product or a proof of unmodeled distributed faults.