Your servers can be healthy while users stare at a broken page. Frontend observability collects signals from real browsers so you can see, alert on, and debug what users actually experience.
Frontend system design · patterns
Design a pipeline that collects metrics, errors, and logs from real browsers. It links them to backend traces and turns them into dashboards and alerts.
Correctness contract: Telemetry must never break or slow the page it measures. It must not leak personal data. Every number on a dashboard must state its sample, its percentile, and its time window.
You know JavaScript, Promises, and basic HTTP. You have seen a backend metrics or logging system. Thresholds for Core Web Vitals are the published Google values as of 2026. Volumes are planning estimates.
Backend teams have used metrics, logs, and traces for years. The browser is harder. You do not control the device, the network, the browser version, or the extensions installed. The page can close at any moment, and data you did not send is gone. Each user's experience is different, so one lab test tells you little. This guide covers how to collect signals and send them without hurting the page. It shows how to make stack traces readable and follow one click into the backend. It ends with alerts that page a human only when users suffer.
Real user monitoring (RUM) measures real page loads on real devices. Synthetic monitoring runs a scripted browser from fixed locations on a schedule. RUM shows the truth for your users. Synthetic gives a stable baseline that is easy to compare.
Example. Lighthouse in CI reports LCP 1.2 s on a fast machine. RUM shows a p75 LCP of 3.4 s, driven by mid-range Android phones in India.
Limit. RUM data is noisy and depends on who visits. A marketing campaign that brings new users on slow phones can move RUM numbers with no code change.
Percentiles
A percentile is the value below which a given share of samples fall. The p75 is the value that 75 percent of page loads beat. Averages hide the slow tail, so frontend metrics use percentiles.
Example. Nine loads at 1 s and one at 30 s give an average of 3.9 s. The p75 is 1 s. The p99 is 30 s. Each tells a different story.
Limit. You cannot average percentiles across regions or hours. Store histograms or sketches, then compute percentiles from merged data.
PerformanceObserver
PerformanceObserver is the browser API that streams performance entries to your code. Entry types include navigation, resource, largest-contentful-paint, layout-shift, event, and long-animation-frame.
Example.new PerformanceObserver(cb).observe({ type: 'largest-contentful-paint', buffered: true }) gives each LCP candidate, including ones that happened before your script ran.
Limit. Support differs. Safari added LCP and INP support later than Chromium. Always feature-detect with PerformanceObserver.supportedEntryTypes.
Distributed trace
A trace is a tree of timed spans that shows one request moving through many services. Each span has a trace id shared by the whole tree and its own span id. The W3C traceparent header carries these ids between services.
Example. A click starts a browser span. The fetch carries traceparent. The API gateway, the cart service, and the database each add child spans to the same trace.
Limit. Cross-origin requests need CORS to allow the header. The browser cannot see server spans unless the backend shares them.
Sampling
Sampling means keeping only part of the data. Head sampling decides at the start, for example per session. Tail sampling decides after seeing the data, for example keeping every trace with an error.
Example. Keep 10 percent of sessions for debug logs, 100 percent of errors, and 100 percent of Web Vitals.
Limit. Sampled counts must be scaled back up. A dashboard that forgets to divide by the sample rate shows numbers ten times too small.
SLI and SLO
A service level indicator (SLI) is a measured ratio of good events to total events. A service level objective (SLO) is the target for that ratio over a window. The gap between 100 percent and the SLO is the error budget.
Example. SLI: share of checkout page views with LCP under 2.5 s and no uncaught error. SLO: 95 percent over 28 days.
Limit. A poor SLI choice gives a false sense of health. "Page loaded" says nothing if the Buy button never became clickable.
1. Real user monitoring
RUM starts with a small script on every page. It records timings and context, then sends them to a collector. The script must be tiny and must load without blocking. A good target is under 10 KB compressed, loaded with async or inlined as a small snippet that queues events until the full library arrives.
What to collect
Navigation timing. From the navigation entry: DNS, TCP, TLS, time to first byte (TTFB), domContentLoadedEventEnd, and loadEventEnd. TTFB above 800 ms usually points at the server or CDN, not the frontend.
Paint and vitals. First Contentful Paint, Largest Contentful Paint, Cumulative Layout Shift, and Interaction to Next Paint.
Resource timing. Per-resource durations from resource entries. Cross-origin resources show only total duration unless the server sends Timing-Allow-Origin.
Long tasks and long animation frames. Main thread blocks over 50 ms. The Long Animation Frames API (long-animation-frame) also names the scripts that ran, which helps find the guilty third-party tag.
Custom marks.performance.mark('search-results-visible') and performance.measure for product moments the browser cannot know about.
SPA route changes. Soft navigations do not create a new navigation entry. Your router must emit its own "route start" and "route ready" events.
Context on every event
A metric without context cannot be sliced. Attach a small, fixed set of dimensions to every event. Use the app version (build hash) and the route template like /product/:id, never the raw URL. Add country, device class, browser, and a session id. Add navigator.connection.effectiveType where present. Keep the set small. Each extra dimension multiplies storage cost in your metrics backend. High-cardinality values such as user id belong in logs or traces, not in metric labels.
Intuition
Lab tests answer "how fast can this page be?". RUM answers "how fast is it for the people who use it?". You need both. Lab tests catch a regression before deploy. RUM tells you whether it mattered.
Device classes
Do not just split by "mobile" and "desktop". A 2024 flagship phone is faster than many office laptops. Bucket by signals you can read: navigator.hardwareConcurrency, navigator.deviceMemory (Chromium only), and screen size. A simple three-tier split such as low, mid, and high is often enough to see where problems live.
2. Core Web Vitals in the field
Core Web Vitals are three user-centered metrics. Google uses them in search ranking and reports them in the Chrome User Experience Report (CrUX). The pass mark for each is at the 75th percentile of page loads, split by mobile and desktop.
Largest Contentful Paint (LCP)
LCP is the time from navigation start until the largest image or text block in the viewport is painted. Good is 2.5 s or less. Poor is over 4 s. The browser emits a new candidate each time a larger element paints. The final value is the last candidate before the user first interacts or scrolls.
When LCP is slow, break it into four parts: TTFB, resource load delay, resource load time, and element render delay. That split tells you who to call. A slow TTFB is a server issue. A long load delay means the browser found the hero image late, often because JavaScript inserted it. Fix that with <link rel="preload"> and fetchpriority="high".
Interaction to Next Paint (INP)
INP replaced First Input Delay in March 2024. It looks at every click, tap, and key press in the page's life. For each, it measures the time from input until the next frame paints. It then reports roughly the worst one, ignoring one outlier per 50 interactions. Good is 200 ms or less. Poor is over 500 ms.
Each interaction has three parts. Input delay is time waiting for a busy main thread. Processing time is your event handlers. Presentation delay is style, layout, and paint. Record all three, plus the target element selector. Without the target, you only know the page is slow, not which button.
Cumulative Layout Shift (CLS)
CLS measures unexpected movement of visible content. Each shift has a score of impact fraction times distance fraction. Shifts are grouped into session windows of up to 5 s, with gaps under 1 s. CLS is the largest window's sum. Good is 0.1 or less. Poor is over 0.25. Shifts within 500 ms of a user input do not count. Record the largest shifting element so you can find the late ad slot or the image with no width and height.
Collecting them correctly
Use the web-vitals library from Google. It handles edge cases that are easy to miss:
Pages restored from the back/forward cache need new values. Listen for pageshow with event.persisted.
Pages loaded in a background tab must not report LCP, since paint was delayed on purpose.
CLS and INP keep changing until the page is hidden. Report the final value on visibilitychange to hidden.
Prerendered pages should measure from activationStart, not from navigation start.
The library's attribution build adds the debug fields above, such as LCP subparts and the INP target. That build is a few KB larger. It is worth it.
Mistake
Reporting CLS or INP on the load event. At load time, the user has not interacted yet and late shifts have not happened. You will report near-perfect numbers that do not match CrUX. Report on page hide.
Your RUM versus CrUX
CrUX is a 28-day rolling dataset from opted-in Chrome users. It is public and it is what search ranking uses. Your RUM covers all browsers and updates in minutes. They will not match exactly. Safari users, logged-in pages, and sampling all differ. Use CrUX as the external scorecard. Use your RUM to debug and to alert, because it can slice by route, version, and device.
3. Error tracking
A JavaScript error in the browser often means a broken button, a blank panel, or a lost form. Users rarely report it. They just leave. So capture errors automatically.
error catches uncaught exceptions. With the capture flag set to true, it also catches failed <script>, <img>, and <link> loads, which do not bubble.
unhandledrejection catches Promise rejections with no catch. In modern code most async failures land here.
Framework boundaries catch render errors the global handler never sees. In React, an error boundary's componentDidCatch gets the error and a component stack. Report both.
Wrap your own fetch client. A 500 from your API is not a JavaScript error, but it is a user-facing failure. Record status, route template, and duration.
The "Script error." problem
A script loaded from another origin, such as your CDN, reports only "Script error." with no stack. This is a browser security rule. Fix it with two steps. Add crossorigin="anonymous" to the <script> tag. Serve the file with Access-Control-Allow-Origin from the CDN. Then full messages and stacks come through.
Grouping and noise
One bug can throw a million times. Group errors by a fingerprint: error type, normalized message (numbers and ids removed), and the top few in-app stack frames after symbolication. Then count users affected, not just events. "40,000 events from 12 users" is a loop. "4,000 events from 3,800 users" is a real incident.
Filter known noise at the client and at the collector:
Errors from browser extensions, with stack frames in chrome-extension:// or moz-extension://.
ResizeObserver loop completed with undelivered notifications, which is usually harmless.
Errors from very old browsers you do not support.
Aborted requests from AbortController when the user navigates away. These are expected, not failures.
Rate limits in the client
Cap reports per page, for example 20 errors and then one "suppressed N more" event. Drop exact duplicates within a few seconds. An infinite render loop that throws 1,000 times a second must not flood the network and freeze the tab.
Tip
Record breadcrumbs: a short ring buffer of the last 30 to 50 events before an error. Include route changes, clicks with target selectors, network calls with status, and console warnings. A stack trace says where it broke. Breadcrumbs say how the user got there.
4. Source maps and symbolication
Production code is bundled and minified. A raw stack frame looks like at e (app.3f9a.js:1:48213). That is useless to a human. A source map is a JSON file that maps each position in the minified file back to the original file, line, column, and name.
How the mapping works
The bundler writes app.3f9a.js.map next to the bundle. It contains the original source file list, an optional list of names, and a mappings string. That string encodes, in Base64 VLQ, a list of segments. Each segment says "generated column X maps to source file S, line L, column C, name N". Symbolication walks the frames, looks up each position, and rewrites the stack.
Where to symbolicate
Do it on the server, not in the browser. Downloading a 5 MB map file into a user's tab after an error is wasteful. It also leaks your source code. The usual setup:
The build generates maps with hidden-source-map style. Bundles do not contain a //# sourceMappingURL comment, so browsers never fetch maps.
CI uploads the maps to the error service, keyed by release version and file name.
The RUM script tags every event with that same release version.
The collector looks up the map for that release and symbolicates the stack before grouping.
The release key is the critical link. If the build hash in the client and the uploaded map version differ, frames resolve to the wrong lines. That is worse than no map, because it points engineers at innocent code.
Mistake
Deploying a new bundle before its source maps finish uploading. The first errors after a deploy are the most important ones, and they arrive unreadable. Make map upload a required step before traffic shifts.
5. Logging and sampling
Logs are discrete records with free-form fields. In the browser they help answer "what happened in this session?" They also cost money. Do the math first.
Volume math
Take 5 million daily active users, 4 sessions each, and 50 log events per session. That is 1 billion events a day. At 300 bytes each, that is 300 GB a day before compression. Ingest and storage at that scale is a real line item. The upload bandwidth also costs the user: 50 events at 300 bytes is 15 KB per session, which matters on a metered phone plan.
Sampling rules
Never sample errors at the client. Rare errors are exactly the ones you need. Rate-limit duplicates instead.
Never sample Web Vitals heavily. You need enough data per route and device class to compute stable p75 values. If a route gets 1,000 views a day, a 1 percent sample gives 10 points, which is noise.
Sample debug logs by session, not by event. Hash the session id and keep a fixed share, such as 10 percent. You then get whole sessions, which you can read end to end. Random per-event sampling gives scattered lines that tell no story.
Promote on error. Keep a ring buffer of recent logs in every session. When an error happens, send the buffer even if the session was not sampled. This is a cheap form of tail sampling.
Record the sample rate on each event. The backend multiplies by 1 / rate when counting. Rates change over time, so a fixed constant in the dashboard query will be wrong.
Structured logs
Log objects, not strings. { event: 'cart.add_failed', status: 503, route: '/cart', version: 'b1e7' } can be filtered and counted. "failed to add to cart: 503" can only be searched. Use a naming scheme for event names and keep a registry, so ten teams do not invent ten names for the same thing.
Interview
When you propose logging, give the volume math and a sampling plan in the same breath. Interviewers want to hear that you know telemetry has a cost for both the company and the user's data plan.
6. Tracing from browser to backend
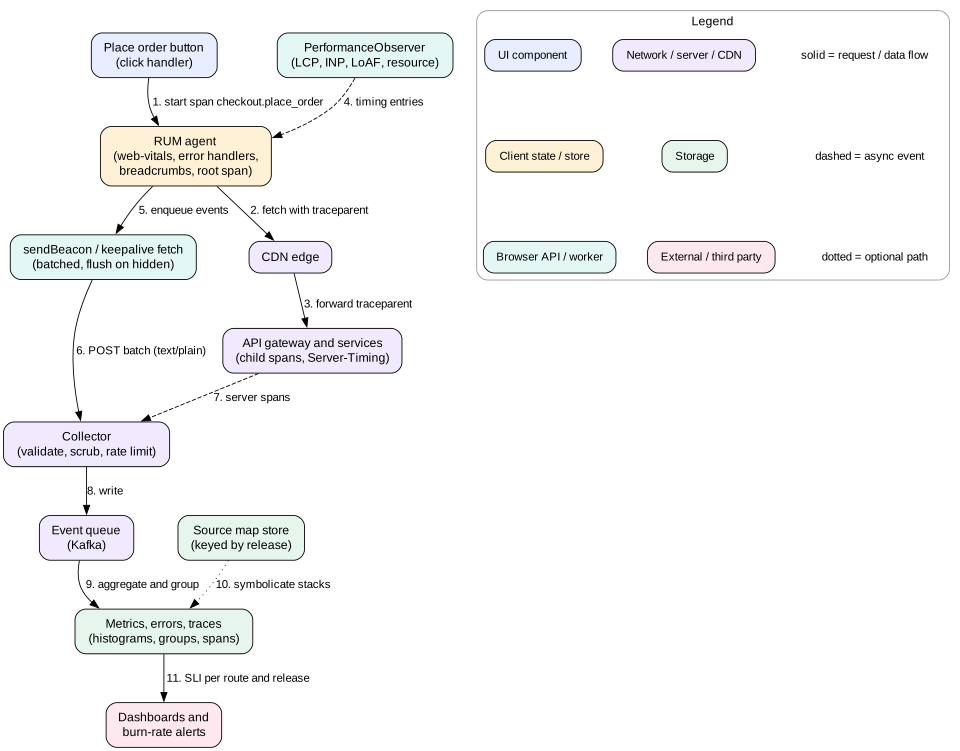
A user clicks "Place order" and waits 6 seconds. Is it the browser, the CDN, the API gateway, the payment service, or the database? Only a trace that starts in the browser can answer that end to end.
End-to-end tracing. The browser creates the root span and passes traceparent on every API call. Telemetry goes to a collector that joins browser and server spans.
The traceparent header
The W3C Trace Context standard defines a header with four fields separated by dashes:
traceparent: 00-4bf92f3577b34da6a3ce929d0e0e4736-00f067aa0ba902b7-01
             |  |                                |                |
          version  trace-id (16 bytes hex)    parent span id   flags (01 = sampled)
The browser generates a random trace id and span id with crypto.getRandomValues. It adds the header to each fetch for that user action. Every backend service reads it, creates child spans with the same trace id, and passes it on. A companion header, tracestate, carries vendor-specific data.
What the browser span contains
The root span is the user action, such as checkout.place_order. Child spans cover the parts the browser can see: the fetch from start to response end, JSON parsing, and the render that shows the result. The Resource Timing entry for the request adds DNS, connect, TLS, and TTFB. Put the route template, release version, and device class on the span as attributes.
CORS and safety
Adding traceparent to a cross-origin request makes it non-simple, so the browser sends a CORS preflight OPTIONS request. The API must list the header in Access-Control-Allow-Headers. Cache the preflight with Access-Control-Max-Age, or each call pays an extra round trip. Only attach the header to your own API origins. Sending it to third parties leaks ids and can break their CORS rules.
Linking the other way
The server can also send ids back. The Server-Timing response header can carry a server trace id and timing values. For example, Server-Timing: db;dur=53, app;dur=120. The browser exposes it in PerformanceResourceTiming.serverTiming. This is useful for page navigations, where the browser starts the request before your script runs and cannot add traceparent.
Sampling traces together
The sampled flag in traceparent should drive the backend's decision. If the browser samples 5 percent of actions and the backend independently samples 1 percent, almost no trace is complete. Let the root decide, and let services follow. Keep all traces with errors or very high latency by also tail sampling at the collector.
Tip
OpenTelemetry has a browser SDK. It provides span APIs, automatic fetch and document load instrumentation, and traceparent propagation. Using the same standard as the backend means one trace store and one query language.
7. Beacons, batching, and the collector
Sending telemetry is a design problem of its own. Send too often and you waste battery and compete with real requests. Send too late and the page closes with data in memory.
When pages die
Mobile browsers kill background tabs without warning. The unload event is unreliable and also blocks the back/forward cache. beforeunload has the same problem. The reliable signal is visibilitychange with document.visibilityState === 'hidden', plus pagehide as a backup for some Safari cases. Treat "hidden" as possibly the last chance to send.
sendBeacon and keepalive
navigator.sendBeacon(url, body) queues a small POST that the browser delivers even after the page is gone. It returns true if queued. It does not return a response. The browser caps the total in-flight beacon data per page, about 64 KB in Chromium. fetch(url, { method: 'POST', body, keepalive: true }) does the same job with more control, such as custom headers, under the same 64 KB budget.
Note one detail. sendBeacon with a string body uses content type text/plain, which avoids a CORS preflight. A Blob with application/json triggers a preflight for cross-origin URLs, and preflights may not complete during unload. Send to a same-origin endpoint, or use text/plain and parse JSON on the server.
Batching
Buffer events in memory. Flush when the batch reaches 20 events or about 16 KB, every 10 to 30 seconds while visible, and immediately on hidden.
Split batches so no single beacon exceeds the keepalive budget.
Compress large batches with CompressionStream('gzip') where supported. Telemetry JSON often compresses five to ten times.
Schedule non-urgent work with requestIdleCallback so serializing does not cause a long task during user input.
Do not retry beacons forever. If a batch fails, drop it, or keep it in IndexedDB for one retry on the next page load.
The collector
The collector is a fleet of stateless HTTP endpoints behind the CDN. It must be cheap per request and very available. It validates and size-limits payloads and rejects unknown schemas. It scrubs personal data a second time. It adds geo from the IP, then drops the IP. Then it writes to a queue such as Kafka. Downstream consumers fan out: metrics aggregation, error grouping, log storage, and trace storage.
Treat the collector as public. Anyone can post to it. Add rate limits per IP and per session. Never trust client fields for billing or security. Ad blockers often block URLs that contain words like analytics or track, so serve the endpoint from your own domain with a neutral path.
Intuition
Telemetry is a guest on the page. It must never take the best seat. User requests come first. Telemetry waits for idle time, travels in small groups, and leaves quietly when the page closes.
8. Session context and privacy
Context makes telemetry useful. It also makes it dangerous. A stack trace with a URL can contain an email address. A breadcrumb with an input value can contain a password.
Session ids
Create a random session id with crypto.randomUUID(). Store it in sessionStorage, or in a first-party cookie with a 30-minute idle timeout. Do not use it for tracking across sites. Link it to a user id only on the server, and only if your privacy policy allows it. A pseudonymous session id is enough to group a session's events.
Scrubbing rules
Replace URLs with route templates. /users/88213/orders/55 becomes /users/:id/orders/:id. Drop query strings, or keep only an allow list of safe keys.
Never record input values. Record that an input changed, not what was typed.
Strip emails, phone numbers, card-like digit runs, and tokens from error messages with patterns on the client, and again at the collector.
Remove Authorization headers and cookies from any network breadcrumb.
Prefer allow lists over block lists. New fields stay out until someone approves them.
Session replay
Session replay tools record DOM mutations so you can watch a session like a video. They are powerful for debugging. They are also a large privacy risk. Mask all text and inputs by default, and unmask only reviewed elements. Sample replay at a low rate, often 1 percent or less, plus sessions with errors. Respect consent. Under rules like GDPR, non-essential telemetry may need user consent before it starts. Check with your legal team.
Mistake
Logging location.href on every event. Password reset links, magic login links, and search terms all live in URLs. One careless field can put secrets into a log store that hundreds of people can read.
9. Dashboards, SLOs, and alerts
Data that nobody looks at is waste. Data that pages people for noise is worse. Design a small set of signals that match user pain.
Frontend SLIs
Load quality. Share of page views with LCP under 2.5 s, per key route.
Responsiveness. Share of page views with INP under 200 ms.
Stability. Share of page views with no uncaught error and no failed critical request.
Journey success. Share of checkout attempts that reach the confirmation screen. This catches bugs that throw no error at all, like a button that does nothing.
Crash-free sessions. Share of sessions without an error boundary fallback screen.
Setting the target
Pick a target that users would notice falling below. Suppose the checkout stability SLO is 99.5 percent over 28 days. With 2 million checkout page views in that window, the error budget is 10,000 bad views. That is about 71,000 views a day. A bug that breaks 30 percent of views burns about 21,000 a day. The whole budget is gone in about 11 hours.
Burn-rate alerts
Do not alert on raw thresholds such as "error count above 100". Traffic changes daily, so the threshold is wrong half the time. Alert on burn rate instead. Burn rate is how fast you are spending the error budget compared to an even pace. A common pattern uses two windows:
Page a human when both the 1-hour and 5-minute burn rates are above 14. That spends 2 percent of a 28-day budget in one hour.
Open a ticket when the 6-hour burn rate is above 6 and the 30-minute rate confirms it.
The short window makes the alert stop quickly once the problem is fixed. The long window prevents paging on a one-minute blip.
Dashboards that help
One overview with the SLIs per key route, split by release version. Most frontend incidents are caused by a deploy, so a version split shows the culprit fast.
Percentile charts from histograms, with the sample count shown. A p75 from 40 samples should look different from one built on 40,000.
Top error groups by users affected, with first-seen release and a link to the symbolicated stack.
Deploy and feature flag change markers on every time chart.
Tip
Tie alerts to automatic action. If a canary release raises the error rate, the deploy system can stop the rollout before a human reads the page.
10. Failure modes
Telemetry slows the page. A heavy RUM bundle or synchronous serialization adds long tasks and hurts the INP you are trying to measure. Keep the agent small and defer work.
Lost data on mobile. Flushing only on unload loses most mobile sessions. Flush on visibilitychange to hidden.
Unreadable stacks. Missing or mismatched source maps, or "Script error." from missing CORS attributes.
Alert storms. An error loop sends millions of events and pages the team for one bug. Client rate limits and grouping by fingerprint prevent this.
Blind spots from blockers. Ad blockers drop requests to known telemetry hosts. Compare RUM page views with server logs to estimate the gap.
Skewed percentiles. Averaging p75 values across regions, or forgetting sample rates, gives wrong numbers that look precise.
Privacy leak. Raw URLs or input values in logs. This is an incident in its own right.
Collector outage. If the collector fails, the client must drop data quietly. It must never retry in a tight loop or throw into the page.
11. Trade-offs
Detail versus cost
Full logs and replays for every session make debugging easy and cost a fortune. Session sampling with promotion on error keeps most of the value at a fraction of the cost.
Build versus buy
Vendors give error grouping, source maps, and dashboards on day one. A home-grown pipeline on OpenTelemetry and your own storage gives control over data location and cost at scale. Many teams start with a vendor and move parts in-house past a few billion events a month.
Real-time versus accurate
Alerts need data within a minute or two. Accurate percentiles need complete data, and some beacons arrive late or never. Use fast, approximate streams for alerts and batch jobs for reports.
Agent features versus page weight
Every feature in the agent costs bytes and CPU on every page. Load the core agent early and lazy-load extras such as replay only for sampled sessions.
12. Interview angle
Observability shows up as "How would you know it is broken?" in almost any frontend design. It can also be the main question: "Design a RUM system." Use this plan.
Minutes 0 to 5. Ask about scale (page views per day), which journeys matter, privacy rules, and whether a vendor is allowed.
Minutes 5 to 12. Client agent. Vitals with PerformanceObserver and web-vitals, global error handlers, breadcrumbs, and context fields. Size budget under 10 KB.
Minutes 12 to 18. Transport. Batching, flush on hidden, sendBeacon limits, sampling plan with volume math.
Minutes 18 to 26. Backend. Collector, queue, symbolication with release-keyed maps, error grouping, metrics from histograms.
Minutes 26 to 33. Tracing with traceparent, CORS preflight cost, and joint sampling.
Minutes 33 to 40. SLIs, SLOs, burn-rate alerts, and release-split dashboards.
Minutes 40 to 45. Privacy, failure modes, and how telemetry protects the page it measures.
Interview
Name the thresholds. "LCP at p75 under 2.5 s, INP under 200 ms, CLS under 0.1" shows you know the field. Then say why p75 and why percentiles must be computed from histograms, not averaged.
13. Summary
RUM measures real users on real devices. Slice it by route template, release, and device class.
Core Web Vitals are judged at p75: LCP 2.5 s, INP 200 ms, CLS 0.1. Report CLS and INP on page hide, with attribution.
Capture errors with error, unhandledrejection, framework boundaries, and a wrapped fetch. Group by fingerprint and count users.
Symbolicate on the server with hidden source maps keyed by release.
Sample logs by session, never sample errors, and promote sessions on error.
Start traces in the browser and pass traceparent to your own APIs.
Batch, flush on visibilitychange, and respect the 64 KB beacon budget.
Scrub personal data twice. Alert on SLO burn rate, split by release.
14. Common mistakes
Relying on lab tests and ignoring field data.
Using averages instead of percentiles, or averaging percentiles.
Sending on unload and losing most mobile data.
Forgetting crossorigin="anonymous" and getting "Script error."
Publishing source maps to the public or uploading them after the deploy.
Putting user ids or raw URLs into metric labels.
Sampling errors away, or forgetting to scale sampled counts.
Paging on raw error counts instead of SLO burn rate.
Letting the telemetry agent add long tasks to the page.
Worked example: a slow checkout after a deploy
An online store ships release b1e8 at 14:00 with a 5 percent canary. Follow the signals.
At 14:00 the deploy system adds a marker to all dashboards. The canary serves 5 percent of sessions with version: b1e8 on every event.
The RUM agent records INP for each checkout page view and reports it on visibilitychange to hidden. Batches go out with sendBeacon as text/plain to /t/collect on the same origin.
The collector writes events to a queue. A streaming job builds INP histograms per route and version every minute.
By 14:12 the checkout INP p75 for b1e8 is 480 ms. For b1e7 it stays at 170 ms. The "good INP" SLI for canary traffic drops from 92 to 61 percent.
The 5-minute and 1-hour burn rates on the canary slice both pass 14. The alert fires and the deploy system pauses the rollout at 5 percent.
The on-call engineer opens the INP attribution view. Most slow interactions target button#place-order. Processing time dominates, at about 350 ms.
Long Animation Frame entries for those interactions name a script, checkout.4c1d.js, function validateCart. The release-keyed source map resolves it to src/cart/validate.ts line 88.
A trace sampled from one of those clicks shows the browser span at 1.9 s. The fetch span to /api/order is only 210 ms. So the backend is healthy. The time is on the main thread.
The diff shows that validateCart now re-validates every line item synchronously, including a regex per field. The fix moves it into a debounced step that runs before the click.
The team rolls back the canary in one click. Canary INP returns to 170 ms within minutes. Only 5 percent of users saw the slow button, for about 15 minutes.
Code lab: batched telemetry queue
This program builds a small telemetry client. It samples debug logs by session with a stable hash. It always keeps errors and vitals. It batches by count and byte size and flushes on page hide. Save it as obs.mjs and run node obs.mjs. In a browser, pass a send function that calls navigator.sendBeacon('/t/collect', body), and call flush('hidden') from a visibilitychange listener.
// Batched telemetry queue with session sampling and a page-hide flush.
// Run with: node obs.mjs (in a browser, swap send() for navigator.sendBeacon)
const MAX_BATCH = 20
const MAX_BYTES = 60_000          // stay under the ~64 KB keepalive limit
const SAMPLE_RATE = 0.1           // keep 10 percent of sessions for logs

function hash32(text) {           // FNV-1a, stable across page loads
  let h = 0x811c9dc5
  for (let i = 0; i < text.length; i++) {
    h ^= text.charCodeAt(i)
    h = Math.imul(h, 0x01000193) >>> 0
  }
  return h
}

function createTelemetry(sessionId, send) {
  const sampled = hash32(sessionId) / 2 ** 32 < SAMPLE_RATE
  let queue = []
  function flush(reason) {
    while (queue.length > 0) {
      const batch = []
      let bytes = 2
      while (queue.length > 0 && batch.length < MAX_BATCH) {
        const size = JSON.stringify(queue[0]).length + 1
        if (bytes + size > MAX_BYTES && batch.length > 0) break
        bytes += size
        batch.push(queue.shift())
      }
      send(JSON.stringify({ sessionId, reason, events: batch }))
    }
  }
  function record(event) {
    // Errors and vitals are always kept. Debug logs follow the sample.
    if (event.kind === 'log' && !sampled) return
    queue.push({ ...event, t: Date.now() })
    if (queue.length >= MAX_BATCH) flush('size')
  }
  return { record, flush, sampled }
}

const sent = []
const tel = createTelemetry('session-42', (body) => sent.push(body))
for (let i = 0; i < 45; i++) tel.record({ kind: 'log', msg: 'click ' + i })
tel.record({ kind: 'error', msg: 'TypeError: x is undefined' })
tel.record({ kind: 'vital', name: 'LCP', value: 2310 })
tel.flush('pagehide')   // browser: addEventListener('pagehide', ...)
console.log('session sampled for logs:', tel.sampled)
for (const body of sent) {
  const b = JSON.parse(body)
  console.log(b.reason, b.events.length, 'events', body.length, 'bytes')
}
With the session id session-42, the hash falls outside the 10 percent sample. So the 45 log events are dropped, and only the error and the LCP vital are sent. Change the session id until sampled is true, and watch the logs split into batches of 20.
Check yourself
Why are Core Web Vitals judged at p75 and not by the average?Answer
Averages hide the slow tail and can be moved by a few extreme values. The p75 means three in four page loads meet the target, which reflects most users while staying stable against outliers.
Your RUM shows CLS of 0.02, but CrUX shows 0.18. What is a likely bug?Answer
The agent reports CLS too early, for example on load. Most shifts happen later, from lazy content or ads. Report the final value when the page becomes hidden.
An error report says only "Script error." with no stack. How do you fix it?Answer
The script is cross-origin. Add crossorigin="anonymous" to the script tag and serve the file with an Access-Control-Allow-Origin header that allows your page origin.
Why sample debug logs per session rather than per event?Answer
Per-session sampling keeps complete sessions you can read from start to end. Per-event sampling gives scattered lines from many sessions, so you cannot reconstruct what any single user did.
Adding traceparent to API calls made them slower. Why, and what is the fix?Answer
The custom header makes cross-origin requests non-simple, so the browser sends a CORS preflight first. Allow the header in Access-Control-Allow-Headers and cache the preflight with Access-Control-Max-Age, or serve the API from the same origin.
Why alert on SLO burn rate instead of on "more than 100 errors per minute"?Answer
Raw thresholds ignore traffic. 100 errors at peak may be normal, while 100 at night may be an outage. Burn rate is a ratio against the error budget, so it scales with traffic and ties alerts to user impact.
Key terms
RUM
Real user monitoring, which measures performance and errors from real user sessions.
CrUX
The Chrome User Experience Report, a public 28-day dataset of field metrics from Chrome users.
LCP
Largest Contentful Paint, the time until the largest visible content element paints.
INP
Interaction to Next Paint, roughly the slowest input-to-paint delay across a page's life.
CLS
Cumulative Layout Shift, the largest burst of unexpected layout movement.
Long animation frame
A frame that took over 50 ms, reported with the scripts that caused it.
Source map
A JSON file that maps minified code positions back to original source lines and names.
Symbolication
Rewriting a minified stack trace into original file names, lines, and function names.
Breadcrumbs
A short buffer of recent user and network events attached to an error report.
traceparent
The W3C header that carries trace id, parent span id, and sampled flag between services.
sendBeacon
A browser API that queues a small POST to be delivered even after the page closes.
Error budget
The allowed share of bad events under an SLO over a time window.
Burn rate
How fast the error budget is being spent, relative to an even pace over the window.