Performance is a user experience feature with clear numbers attached. This guide explains the three Core Web Vitals and how to measure them in the lab and in the field. It also covers the main techniques that move each one.
Frontend system design · foundations
Set measurable performance budgets for a page, find what blocks each Core Web Vital, and choose fixes with known costs.
Correctness contract: Optimizations must never change what the user sees or can do. Lazy content must still load before the user needs it. Cached responses must never show another user's data or an incompatible old build.
You know HTML, CSS, JavaScript, and basic HTTP. You have opened browser DevTools. Thresholds come from the Web Vitals program. Timings for devices and networks are illustrative, not benchmarks.
Users feel three things when a page loads and runs. Does the main content show up quickly? Does the page react when I tap? Does stuff jump around while I read? Core Web Vitals turn these feelings into three metrics: Largest Contentful Paint, Interaction to Next Paint, and Cumulative Layout Shift. Companies track them because they relate to bounce rate, conversion, and search ranking. In an interview, performance is where you prove depth. You name a metric, give its threshold, explain what in the browser makes it slow, and pick a fix with a known cost. This guide gives you that toolbox.
Web Vitals are judged at the 75th percentile (p75) of real page loads. That means 75 percent of visits must meet the threshold for the page to pass.
Example. If 1,000 visits have LCP values and the 750th fastest is 2.4 s, the page passes LCP. The slowest 250 can still be bad.
Limit. p75 hides the tail. Users on old phones in weak networks may live above p75. Track p95 too if they matter to your business.
Long task
A long task is any main-thread task that runs longer than 50 ms. While it runs, the browser cannot handle input or paint.
Example. A click handler that sorts 50,000 rows takes 180 ms. A tap during that time waits for the sort to finish.
Limit. Splitting work into small tasks helps only if you yield between them. A loop of small functions in one task is still one long task.
Lab versus field data
Lab data comes from a controlled test, such as Lighthouse on a throttled device. Field data comes from real users, collected by real user monitoring (RUM).
Example. Lighthouse shows LCP of 1.9 s. Field p75 is 3.6 s, because many real users are on slow phones far from the CDN.
Limit. Lab tests cannot measure INP well, since there is no real user input. Use Total Blocking Time as a lab proxy.
Fetch priority
Browsers assign each request a priority. CSS and fonts are high. Images start low. You can raise or lower priority with fetchpriority and resource hints.
Example. Adding fetchpriority="high" to the hero image often moves LCP earlier by hundreds of milliseconds on busy pages.
Limit. Priority is relative. Marking everything high is the same as marking nothing high, and it can delay CSS.
Compositor-only animation
The compositor thread can move and fade layers without the main thread. Animating transform and opacity stays smooth even when JavaScript is busy.
Example. A drawer that slides with transform: translateX() runs at 60 fps. The same drawer animating left triggers layout every frame.
Limit. Each promoted layer costs GPU memory. Hundreds of will-change layers can make mobile pages slower or crash tabs.
Cache-Control
Cache-Control is the HTTP header that tells browsers and CDNs how long and where they may reuse a response.
Example.app.3f9a2c.js served with public, max-age=31536000, immutable is never requested again until its name changes.
Limit. Long caching is safe only for content-hashed URLs. A long cache on index.html traps users on an old build.
1. Core Web Vitals and their thresholds
Each vital has a "good" threshold and a "poor" threshold. Values in between "need improvement". All are judged at p75 of page loads, split by mobile and desktop.
Largest Contentful Paint (LCP)
What it measures. When the largest image, video poster, or text block in the viewport is painted. It stands for "main content visible".
Thresholds. Good is 2.5 s or less. Poor is over 4.0 s.
Parts of LCP. LCP splits into four phases. Time to First Byte. Resource load delay, the gap until the browser starts fetching the LCP resource. Resource load duration. Element render delay, the gap between load and paint.
Typical causes. Slow server, hero image found late, image too large, render-blocking CSS or scripts, or content rendered by client JavaScript.
Interaction to Next Paint (INP)
What it measures. The delay from a tap, click, or key press until the next frame paints. It looks at all interactions in the visit and reports close to the worst one. With many interactions it ignores one outlier per 50.
Thresholds. Good is 200 ms or less. Poor is over 500 ms.
Parts of INP. Input delay, while the main thread finishes other work. Processing time, while your event handlers run. Presentation delay, while the browser does style, layout, and paint for the new frame.
History. INP replaced First Input Delay as a Core Web Vital in March 2024. FID measured only the input delay of the first interaction, so it missed slow handlers and later interactions.
Cumulative Layout Shift (CLS)
What it measures. How much visible content moves without the user causing it. Each shift scores impact fraction times distance fraction.
Thresholds. Good is 0.1 or less. Poor is over 0.25.
Session windows. Shifts are grouped into windows. A window ends after a 1 second gap with no shifts, or after 5 seconds total. CLS is the largest window score, not the sum over the whole visit.
Exclusions. Shifts within 500 ms after a user input do not count, because the user expected a change.
Intuition
LCP asks "did the meal arrive?" INP asks "does the waiter respond when I wave?" CLS asks "did someone move my plate while I was eating?"
Supporting metrics
TTFB. Time to First Byte. Good is about 800 ms or less. It is the floor under every other loading metric.
FCP. First Contentful Paint. Good is 1.8 s or less. Shows the page is alive.
TBT. Total Blocking Time. The sum of the part over 50 ms of each long task between FCP and load. A lab proxy for INP.
2. Measuring: lab versus field
Lab tools
Lighthouse runs a page load with simulated throttling, such as a mid-range phone on slow 4G. It reports LCP, CLS, TBT, and audits with fixes.
Chrome DevTools Performance panel records a trace. You see the main thread flame chart, long tasks in red, network waterfall, layout shifts, and frames.
WebPageTest runs real devices in real locations. It shows filmstrips and lets you script logins and multi-step flows.
Lab data is repeatable. Use it to debug, to compare two builds, and to block regressions in CI. It does not tell you what users actually feel.
Field data and RUM
Chrome User Experience Report (CrUX) is public field data from opted-in Chrome users. It is grouped per origin and per URL over 28 days.
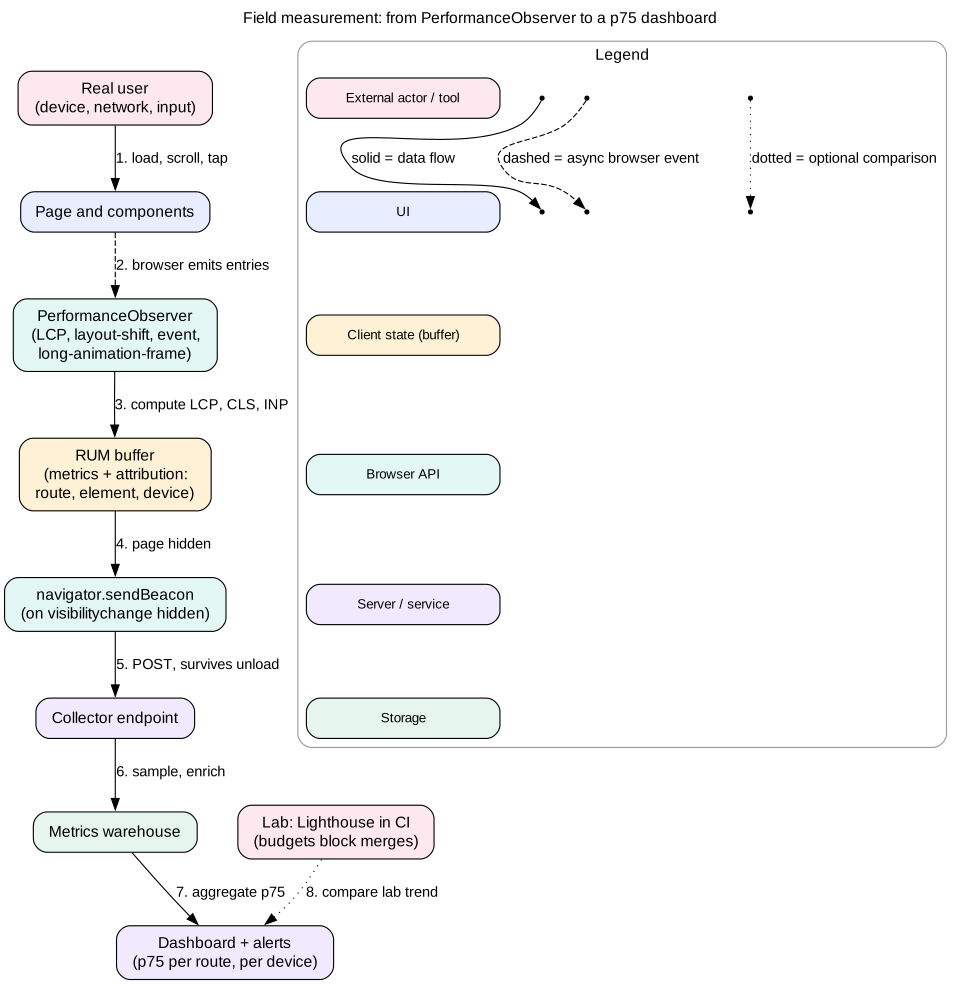
Your own RUM collects metrics from every visit or a sample. You add attribution, such as route, device class, country, and which element was LCP.
PerformanceObserver
Browsers expose performance entries through PerformanceObserver. You subscribe to entry types and get callbacks as entries arrive. Use buffered: true to also get entries recorded before your script ran.
largest-contentful-paint entries give LCP candidates. The last one before the first input is the LCP.
layout-shift entries give shift values and hadRecentInput.
event entries give interaction timing with an interactionId. Group by ID and take the longest duration per interaction.
long-animation-frame entries, from the Long Animation Frames API, show slow frames and which scripts caused them. This is the best tool for INP attribution.
navigation and resource entries give the network timings for the document and each file.
Send data when the page becomes hidden, using the visibilitychange event and navigator.sendBeacon. Do not rely on unload. It is unreliable on mobile and it blocks the back/forward cache. In practice, many teams use Google's small web-vitals library, which handles the edge cases.
Figure 1. A RUM pipeline. Lab tests in CI catch regressions early, and field p75 decides success.
Tip
Segment field data. A single p75 across all users hides problems. Split by route, by device memory or class, by connection type, and by country. Then fix the worst segment that matters most to the business.
3. Performance budgets
A budget is a limit the team agrees not to exceed. It turns performance from a one-time project into a habit. There are three kinds.
Milestone budgets. User-facing metrics, such as "LCP p75 at most 2.5 s on mobile" and "INP p75 at most 200 ms".
Quantity budgets. Things you control directly, such as "at most 170 KB of compressed JavaScript per route", "hero image under 100 KB", and "at most 4 third-party scripts".
Rule budgets. Lighthouse scores or audits, such as "performance score at least 90 in CI".
Deriving a JavaScript budget
Pick the target device: a mid-range Android phone, perhaps four times slower than a laptop at running JavaScript.
Pick the network: 4G with about 1.6 Mbps of real throughput and 150 ms round trips.
Pick the goal: interactive within about 3.5 s.
Subtract about 1 s for connection setup and HTML. 2.5 s remain.
Download at 200 KB per second and parse plus execute at about 2 ms per KB of uncompressed code on this phone.
170 KB compressed is about 600 KB uncompressed. Download takes about 0.85 s and execution about 1.2 to 1.5 s. Total is about 2.2 s, which fits.
Enforce budgets in CI. Tools like Lighthouse CI and bundler size limits can fail a pull request that crosses a budget. Show the size change on every pull request so engineers see the cost of each import.
Interview
Always attach a budget to a reason. "Most of our users are on Android in India, so I budget for a Moto G class phone on 4G. That gives about 170 KB of JavaScript for the first route."
4. Bundle size and code splitting
JavaScript is the most expensive byte on the web. An image of 170 KB only needs decoding, often off the main thread. JavaScript of 170 KB must be parsed, compiled, and run on the main thread.
Code splitting
Route-based splitting. Each route is its own chunk. Users download only the code for the page they visit. Most frameworks do this by default.
Component-based splitting. Load heavy, rarely used parts on demand with dynamic import(). Examples are a rich text editor, a chart library, or a map. In React, use React.lazy with Suspense.
Interaction-based loading. Load code when the user shows intent, such as on hover, focus, or the first click. Show a light placeholder until then.
Vendor splitting. Put stable libraries in a separate chunk. It stays cached across deploys while your app code changes.
Reducing what you ship
Tree shaking. Use ES modules so the bundler can drop unused exports. Avoid libraries that only ship CommonJS.
Replace heavy libraries. A full date library may cost 70 KB. Intl.DateTimeFormat and Intl.RelativeTimeFormat are free.
Modern output. Ship modern syntax to modern browsers. Old transpile targets add polyfills and longer code.
Compression. Serve Brotli where possible. It is often 15 to 20 percent smaller than gzip for JavaScript.
Bundle analysis. Use a bundle visualizer to find large or duplicated packages. Two versions of the same library are a common surprise.
Third-party scripts
Tag managers, analytics, chat widgets, and ads often cost more than your own code. Load them with async or defer, after the main content, or on interaction. Give them a budget, review them quarterly, and remove the ones nobody uses. Consider running some in a Web Worker with a tool like Partytown, though compatibility varies.
Mistake
Splitting too finely. Hundreds of tiny chunks create request overhead and waterfalls, where one chunk loads another that loads another. Aim for meaningful chunks of tens of kilobytes, and preload chunks you know a route needs.
5. The critical path: preload, preconnect, fetchpriority
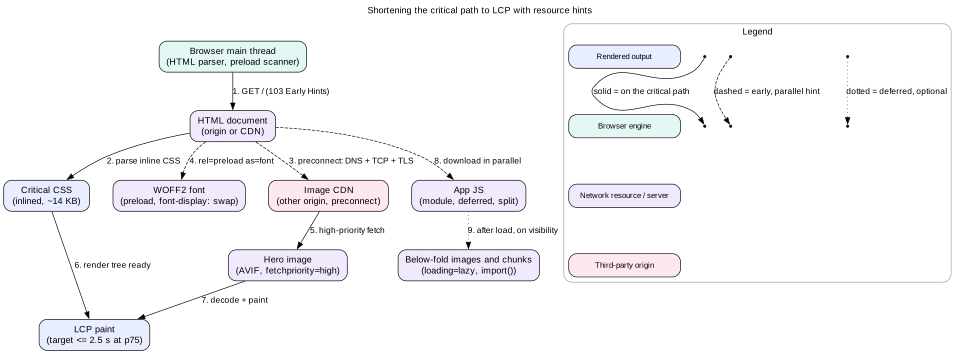
The critical path is the chain of requests that must finish before the main content paints. Shortening it is the main way to improve LCP. You have four kinds of tools.
Remove blockers
Inline the critical CSS needed for above-the-fold content. Load the rest without blocking, or split CSS by route.
Use defer or type="module" for scripts, so they do not block the parser.
Keep the first HTML response small. TCP slow start sends about 14 KB in the first round trip. Content in those bytes arrives soonest.
Discover resources early
<link rel="preload" href="/hero.avif" as="image"> fetches a resource the browser needs soon but cannot find early. Examples are a CSS background image or a font.
<link rel="modulepreload"> fetches and parses a JavaScript module and its dependencies early.
Put the LCP image as a normal <img> in the server HTML. Then the preload scanner finds it without any hint.
103 Early Hints lets the server or CDN send preload and preconnect headers before the final response is ready.
Warm up connections
<link rel="preconnect" href="https://img.example-cdn.com"> opens DNS, TCP, and TLS to another origin early. On a 150 ms round trip link this can save 300 to 450 ms.
Preconnect only to two or three origins you will surely use soon. Each open connection costs CPU and is closed if unused after about 10 seconds.
dns-prefetch is a cheaper fallback that only resolves DNS.
Set priorities
fetchpriority="high" on the LCP image raises it from the low default for images.
fetchpriority="low" on below-the-fold carousel images and non-critical fetches keeps bandwidth for important work.
fetch(url, { priority: 'low' }) works for API requests.
Figure 2. A short critical path. Solid edges block LCP, dashed edges are early parallel hints, and dotted edges are deferred.
Next-page speed
For the next navigation, use <link rel="prefetch"> for likely resources, or the Speculation Rules API to prefetch or prerender likely next pages. A prerendered page can appear almost instantly. Use it carefully, since wrong guesses waste bandwidth and server load.
6. Images
Images are the LCP element on most pages and often the largest share of bytes. Get four things right: format, size, loading, and layout.
Formats
AVIF often gives files about 50 percent smaller than JPEG at similar quality. Encoding is slower, so do it at build time or in an image CDN.
WebP is about 25 to 35 percent smaller than JPEG and is supported in all modern browsers.
SVG fits icons and logos. Avoid icon fonts.
Use <picture> with <source type="image/avif"> and a JPEG fallback, or let an image CDN choose by the Accept header.
Responsive sizes
A phone with a 400 CSS pixel wide screen and a device pixel ratio of 2.5 needs an image about 1000 pixels wide. Sending a 2400 pixel desktop image wastes bandwidth and decode time. Use srcset with width descriptors and a correct sizes attribute.
Use loading="lazy" on images below the fold. The browser loads them as they approach the viewport.
Never lazy-load the LCP image. It delays the most important paint.
Use decoding="async" on large non-critical images so decode does not block other work.
Remember memory. A decoded 1200 by 1200 image costs about 5.8 MB at 4 bytes per pixel. A grid of 100 such images can cost 580 MB and crash a low-end tab.
Layout
Always set width and height attributes, or CSS aspect-ratio. The browser then reserves the right space before the image loads. This removes the most common cause of layout shift.
Tip
Use a low-quality placeholder, such as a tiny blurred image or a dominant color, for large images. It gives a sense of progress. Note that LCP counts the real image, not the placeholder, so this helps users but may not move the metric.
7. Fonts
Web fonts can delay text paint and cause layout shift. Browsers hide text for up to 3 seconds while a font loads, unless you tell them otherwise.
Use WOFF2. It is the best compressed font format and supported everywhere modern.
Subset. Ship only the characters you need, using unicode-range to split by script. A Latin subset can be 20 KB instead of 200 KB.
Preload the main font.<link rel="preload" href="/f/inter.woff2" as="font" type="font/woff2" crossorigin>. The crossorigin attribute is required for fonts, even on the same origin.
Choose a font-display.swap shows fallback text at once and swaps when the font arrives. optional uses the font only if it arrives very fast, which avoids late swaps.
Match fallback metrics. Use size-adjust, ascent-override, and descent-override on a fallback @font-face. Then the swap does not shift text lines.
Limit families and weights. Each weight is a file. A variable font can replace several weights with one file.
Self-host. Serving fonts from your own origin avoids an extra connection to a font provider.
8. Main-thread work and INP
INP is about the main thread. If the thread is busy when the user taps, the tap waits. If your handler does a lot of work, the next paint waits. If the DOM change is large, style and layout wait.
Find the work
Record a Performance trace in DevTools and interact. Look for long tasks with red corners. Use the Long Animation Frames API in the field to learn which scripts cause slow interactions for real users.
Yield to the browser
Break long work into chunks and give the browser a chance to handle input and paint between them.
await scheduler.yield() pauses your task and lets the browser run pending work. Your code resumes with priority over other queued tasks. It is available in Chromium browsers.
Fall back to await new Promise((r) => setTimeout(r, 0)) where scheduler.yield is missing.
requestIdleCallback runs work when the browser is idle, such as analytics or prefetching.
Do the visible part first
In a handler, update the UI that the user is waiting for, then yield, then do the rest. For example, close the menu and show a spinner first. Then send analytics, update caches, and save state. The next paint happens after the first part, so INP is short.
button.addEventListener('click', async () => {
  showSelectedState()               // cheap, visible change
  await scheduler.yield()           // let the browser paint now
  recomputeTotals()                 // heavier work in a new task
  sendAnalytics()
})
Move work off the main thread
Web Workers run JavaScript on another thread. Use them for parsing large JSON, search indexing, diffing, image processing, and crypto. Communicate with postMessage. Transfer ArrayBuffer objects to avoid copying.
OffscreenCanvas lets a worker draw charts or canvas graphics.
Workers cannot touch the DOM. Keep DOM updates on the main thread and keep them small.
Reduce rendering work
Avoid layout thrashing. Do not read layout values, such as offsetHeight, right after writing styles in a loop. Batch reads, then batch writes, or use requestAnimationFrame.
Keep re-renders narrow. In React, use useTransition or useDeferredValue to mark non-urgent updates, so typing stays responsive while a big list updates.
Debounce expensive work tied to fast events, such as filtering on input. Throttle scroll handlers, or better, use IntersectionObserver.
Animate only transform and opacity where possible.
Intuition
The main thread is a single cashier. A customer with 300 items blocks everyone. Yielding is like the cashier serving one quick customer after every 20 items. A Web Worker is a second cashier who can do anything except touch the shelves.
9. Preventing layout shift
Layout shift happens when the browser must move content after it painted. The fix is almost always to reserve space early.
Media. Set width and height or aspect-ratio on images, videos, and iframes.
Ads and embeds. Reserve a slot with a min-height for the most common ad size. If no ad fills, keep the space or collapse it with a placeholder, not suddenly.
Late content. Do not insert banners, cookie notices, or "new posts" above existing content. Use overlays, or reserve space in the server HTML.
Fonts. Match fallback metrics with size-adjust and the override descriptors.
Animations. Animate with transform. Changing top, height, or margin shifts neighbors.
Skeletons. Make skeletons the same size as the real content.
Back/forward cache. Pages restored from bfcache appear instantly with no shifts. Avoid unload handlers so pages stay eligible.
10. Virtualization and large DOMs
Every DOM node costs memory, style calculation, and layout. A table of 10,000 rows at 15 nodes each is 150,000 nodes. Style recalculation on that can take hundreds of milliseconds on a phone.
List virtualization
Virtualization, also called windowing, renders only the rows in or near the viewport. A spacer element keeps the scrollbar the right size. As the user scrolls, rows are recycled with new data.
For 10,000 rows of 48 px in an 800 px viewport, about 17 rows are visible. With an overscan of 5 above and below, you render about 27 rows instead of 10,000.
Fixed row heights are simplest. Variable heights need measurement with ResizeObserver and an estimated size for unmeasured rows.
Keep focus and screen readers in mind. Set aria-rowcount and aria-rowindex on grids. Do not let the focused row be recycled.
Browser find-in-page cannot see rows that are not rendered. Provide in-app search if users need it.
content-visibility
The CSS property content-visibility: auto tells the browser to skip rendering work for off-screen sections. Pair it with contain-intrinsic-size: auto 500px so the browser reserves an estimated height. The nodes stay in the DOM, so find-in-page and accessibility still work. It is a good fit for long articles and pages with many sections. It does not reduce memory like virtualization does.
Tip
Rule of thumb: under a few hundred simple items, render them all. From hundreds to a few thousand sections, try content-visibility. Beyond that, or for complex rows, virtualize.
11. Caching with HTTP headers and Service Workers
The fastest request is the one you never make. Caching makes repeat visits and navigations fast. It also lowers server cost.
HTTP caching headers
Hashed static assets.Cache-Control: public, max-age=31536000, immutable. The file name changes on every content change, so the old one can be cached forever.
HTML documents.Cache-Control: no-cache plus an ETag. The browser revalidates each time and gets a tiny 304 Not Modified if nothing changed.
Public pages at the CDN.Cache-Control: public, max-age=0, s-maxage=300, stale-while-revalidate=86400. The CDN serves for 5 minutes, then serves stale while it refreshes.
Personal data.Cache-Control: private, no-store for sensitive responses. private alone lets the browser cache but forbids shared caches.
Validators.ETag with If-None-Match, or Last-Modified with If-Modified-Since, turn full downloads into small 304 responses.
Vary. Tells caches which request headers change the response, such as Accept-Encoding. Avoid Vary: Cookie on cacheable pages.
Service Workers
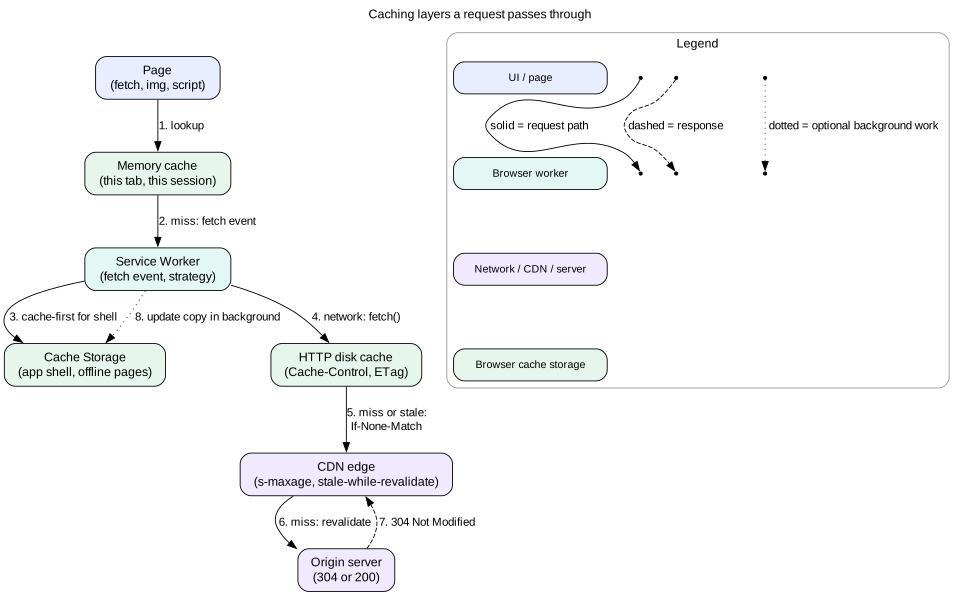
A Service Worker is a script that sits between your page and the network. It receives a fetch event for each request and can answer from Cache Storage, from the network, or from both. It enables offline support and instant repeat loads.
Cache first. Answer from cache and fall back to network. Use for versioned static assets and the app shell.
Network first. Try network with a timeout and fall back to cache. Use for HTML and API data where freshness matters.
Stale-while-revalidate. Answer from cache at once and update the cache from network in the background. Use for avatars, non-critical API data, and fonts.
Precaching. Download the app shell at install time so the next visit works offline.
Navigation preload. Lets the browser start the network request for a navigation while the Service Worker boots, which removes its startup delay.
Figure 3. A request can be answered at any of these layers. Each layer has its own rules and its own way to go stale.
Mistake
Caching the HTML shell cache-first in a Service Worker with no update plan. Users stay on an old build for days. Use network first for HTML, or show a "new version available" prompt when the worker detects an update.
12. Failure modes
Lab green, field red. Lighthouse passes but real users suffer. Fix by adding RUM with device and network segments.
LCP image lazy-loaded. A shared image component adds loading="lazy" everywhere. Add a priority prop for above-the-fold images.
Preload not used. A preloaded file is never requested by the page, often due to a crossorigin mismatch. Chrome warns in the console. The bytes are wasted and compete with real work.
Third-party regression. A marketing tag adds a 400 ms long task. Monitor third-party cost in RUM and load tags after interaction.
Hydration long task. Server rendering makes LCP good but INP poor during load. Reduce client components and use selective hydration.
Memory crash. Infinite scroll with full-size images grows memory until the tab is killed. Virtualize and use correctly sized images.
Stale Service Worker. A broken worker serves a broken app to every returning user. Keep a kill switch, such as a no-op worker you can deploy fast, and use Clear-Site-Data in an emergency.
Chunk load failure after deploy. An open tab requests a chunk deleted by a new deploy. Keep old assets for some days, and reload once on chunk errors.
13. Trade-offs
Inline CSS versus external CSS
Inlining critical CSS saves a round trip on the first visit. It makes every HTML response bigger and cannot be cached separately. Inline only the above-the-fold part, about 10 to 14 KB.
Code splitting versus request count
More chunks mean less unused code. They also mean more requests and possible waterfalls. Split by route and by heavy feature, then preload what each route needs.
Lazy loading versus readiness
Lazy loading saves bytes for content users never see. It can make content appear late on fast scrolls. Use generous rootMargin and never lazy-load what is above the fold.
Virtualization versus native behavior
Virtualization keeps huge lists fast. It breaks find-in-page and adds focus and accessibility work. content-visibility is a lighter middle ground.
Aggressive caching versus freshness
Long caches make repeat visits instant and cut costs. They risk stale content and stuck builds. Use content hashing for assets and revalidation for documents.
Web Workers versus simplicity
Workers free the main thread. They add message passing, serialization cost, and a second bundle. Use them for CPU-heavy work over about 50 ms, not for small tasks.
14. Interview angle
Performance is usually a deep dive in the Optimizations step. Interviewers want structure and numbers, not a list of tricks.
Name the metric that matters most for this product. For a feed it is INP and scroll smoothness. For a landing page it is LCP.
Give the threshold and the target device and network.
Break the metric into parts. For LCP: TTFB, load delay, load time, render delay. For INP: input delay, processing, presentation.
Pick the biggest part and give a fix with its cost.
Say how you measure it in the field and how you prevent regressions in CI.
Interview
A staff-level answer ties performance to the business and to process. "We set per-route budgets in CI and segment RUM by device class. Each new third-party tag needs a performance review. We report p75 LCP and INP next to conversion in the weekly business review."
15. Summary
LCP good is 2.5 s or less, INP good is 200 ms or less, and CLS good is 0.1 or less, all at p75.
Use lab tools to debug and to guard CI. Use field RUM with PerformanceObserver to know what users feel.
Set budgets for metrics and for quantities like JavaScript bytes, and enforce them on every pull request.
Split code by route and feature. Remove heavy libraries and control third-party scripts.
Shorten the critical path: inline critical CSS, discover the LCP image early, preconnect, and use fetchpriority.
Serve responsive AVIF or WebP images with dimensions. Lazy-load below the fold only.
Keep the main thread free: yield with scheduler.yield, move heavy work to workers, and update the visible UI first.
Reserve space to prevent shifts. Virtualize huge lists. Cache hashed assets forever and revalidate HTML.
16. Common mistakes
Optimizing without measuring. Guessing which part is slow instead of reading a trace.
Trusting only Lighthouse. Lab scores on a fast laptop do not match field p75.
Lazy-loading the hero image. This directly delays LCP.
No image dimensions. Images push text down as they load and raise CLS.
Preloading everything. Hints compete for bandwidth and lose their meaning.
Heavy work in event handlers. All logic runs before the next paint, so INP suffers.
Rendering 10,000 rows. Huge DOMs make style, layout, and memory explode.
Long cache on HTML. Users get stuck on old builds that reference deleted files.
Worked example: fixing a slow product listing page
Scenario: a product listing page. Field data shows mobile p75 LCP at 4.2 s, INP at 380 ms, and CLS at 0.22. The target is to pass all three.
Segment the data. RUM shows the worst numbers on low-memory Android devices. The LCP element is the first product image in 70 percent of visits.
Break down LCP. TTFB is 0.9 s. Resource load delay is 1.6 s, because the grid renders on the client after a 280 KB bundle runs. Load duration is 1.1 s for a 400 KB JPEG. Render delay is 0.6 s.
Fix load delay. Server-render the first 8 products. The first image is now in the HTML, so the preload scanner finds it. Add fetchpriority="high" to that image only.
Fix load duration. Serve AVIF through an image CDN with srcset. The phone now gets an 800 pixel AVIF of 70 KB. Add preconnect to the image CDN.
Fix TTFB. Cache the listing HTML at the CDN for 60 seconds with stale-while-revalidate. Fetch personal parts, such as the wishlist state, on the client.
New LCP estimate. TTFB 0.2 s, load delay 0.3 s, load 0.5 s, render delay 0.2 s. Total about 1.2 to 1.6 s at p75.
Break down INP. A Long Animation Frames trace shows the filter click handler takes 260 ms. It filters 3,000 products, re-renders all cards, and sends analytics in one task.
Fix INP. Update the selected filter chip first and yield with scheduler.yield(). Move filtering to a Web Worker. Render results with useTransition. Virtualize the grid so only about 24 cards render. Send analytics in requestIdleCallback.
Fix CLS. Product images had no dimensions. Add width, height, and aspect-ratio. A promo banner was inserted above the grid after load. Reserve its slot in the server HTML.
Guard the gains. Add Lighthouse CI with a 170 KB route budget. Track p75 LCP, INP, and CLS per route in RUM with alerts at 10 percent regression. After two weeks, field p75 shows LCP 1.8 s, INP 140 ms, and CLS 0.03.
Code lab: measure Web Vitals with PerformanceObserver
This snippet computes approximate LCP, CLS, and INP, and counts long tasks, using only browser APIs. To run it, open any page in Chrome or Edge, open DevTools, paste it into the Console, and then scroll and click around. It prints the values every 3 seconds. In production you would send them with sendBeacon to your own endpoint.
const vitals = { lcp: 0, cls: 0, inp: 0, longTasks: 0 }
const rate = (v, good, poor) => (v <= good ? 'good' : v <= poor ? 'needs-improvement' : 'poor')

new PerformanceObserver((list) => {
  const last = list.getEntries().at(-1) // latest LCP candidate wins
  vitals.lcp = Math.round(last.startTime)
}).observe({ type: 'largest-contentful-paint', buffered: true })

let windowValue = 0
let windowStart = 0
let lastShift = 0
new PerformanceObserver((list) => {
  for (const e of list.getEntries()) {
    if (e.hadRecentInput) continue
    const newWindow = e.startTime - lastShift > 1000 || e.startTime - windowStart > 5000
    if (newWindow) { windowValue = 0; windowStart = e.startTime }
    windowValue += e.value
    lastShift = e.startTime
    vitals.cls = Math.max(vitals.cls, Number(windowValue.toFixed(4)))
  }
}).observe({ type: 'layout-shift', buffered: true })

const interactions = new Map() // interactionId -> longest duration
new PerformanceObserver((list) => {
  for (const e of list.getEntries()) {
    if (!e.interactionId) continue
    interactions.set(e.interactionId, Math.max(interactions.get(e.interactionId) ?? 0, e.duration))
  }
  const sorted = [...interactions.values()].sort((a, b) => b - a)
  const skip = Math.min(sorted.length - 1, Math.floor(sorted.length / 50)) // 1 outlier per 50
  vitals.inp = sorted[skip] ?? 0
}).observe({ type: 'event', durationThreshold: 16, buffered: true })

new PerformanceObserver((list) => {
  vitals.longTasks += list.getEntries().length
}).observe({ type: 'longtask', buffered: true })

const report = () => console.log(JSON.stringify({
  ...vitals,
  lcpRating: rate(vitals.lcp, 2500, 4000),
  inpRating: rate(vitals.inp, 200, 500),
  clsRating: rate(vitals.cls, 0.1, 0.25),
}))
setInterval(report, 3000)
document.addEventListener('visibilitychange', () => {
  if (document.visibilityState === 'hidden') report() // swap for navigator.sendBeacon('/rum', ...)
})
Try it on a heavy news site. Then open the Performance panel, set CPU throttling to 4x slowdown, reload, and compare. The numbers are close to, but simpler than, the official web-vitals library. For example, the library also handles bfcache restores and prerendered pages.
Check yourself
Name the good thresholds for LCP, INP, and CLS, and the percentile they are judged at.Answer
LCP 2.5 s or less, INP 200 ms or less, CLS 0.1 or less. They are judged at the 75th percentile of page loads, split by mobile and desktop.
What are the four parts of LCP, and which fix targets resource load delay?Answer
TTFB, resource load delay, resource load duration, and element render delay. To cut load delay, put the LCP image in the server HTML so the preload scanner finds it. Also add fetchpriority="high", or preload it if it cannot be in the HTML.
Why can a lab test not measure INP well, and what do you use instead?Answer
INP depends on real user interactions during the whole visit, which a page-load test does not have. In the lab, Total Blocking Time is the proxy. In the field, collect INP with RUM.
A click handler takes 250 ms. Give two ways to improve INP without removing the work.Answer
Do the visible update first, then await scheduler.yield() so the browser paints before the rest runs. Or move the heavy computation to a Web Worker and update the DOM when it replies.
Which Cache-Control headers would you use for app.3f9a2c.js and for index.html?Answer
For the hashed asset, public, max-age=31536000, immutable. For HTML, no-cache with an ETag, so the browser revalidates every time and gets a 304 when unchanged.
When would you choose content-visibility: auto over list virtualization?Answer
For long pages with hundreds to a few thousand sections, where you want find-in-page and accessibility to keep working. Virtualization is better for very large or complex lists where DOM size and memory must stay small.
Why does CLS use session windows instead of summing all shifts?Answer
Summing would punish long-lived pages, such as single-page apps open for hours, even if each shift is small. Windows of at most 5 seconds, split by 1 second gaps, capture the worst burst of shifts the user felt.
Key terms
LCP
Largest Contentful Paint. When the largest content element in the viewport paints. Good is 2.5 s or less.
INP
Interaction to Next Paint. Near-worst delay from user input to the next frame. Good is 200 ms or less.
CLS
Cumulative Layout Shift. The largest burst of unexpected layout movement. Good is 0.1 or less.
TTFB
Time to First Byte of the document response.
TBT
Total Blocking Time. A lab metric that sums long-task time over 50 ms.
RUM
Real user monitoring. Collecting performance data from real visits.
PerformanceObserver
A browser API that delivers performance entries such as LCP, layout shifts, and event timing.
Long task
A main-thread task over 50 ms that blocks input and paint.
Critical path
The chain of requests and work that must finish before main content paints.
fetchpriority
An HTML attribute that hints the relative priority of a resource fetch.
Preconnect
A resource hint that opens a connection to an origin early.
Virtualization
Rendering only the visible part of a long list.
Service Worker
A script that intercepts network requests and can serve from Cache Storage.
Performance budget
An agreed limit on a metric or quantity, enforced in CI.