A frontend system design walkthrough for a slippy map in the browser. You will learn how tiles are named and how they become pixels at 60 frames per second. You will also learn how the app stays usable on slow phones and with no network.
Frontend system design · Design problem
Design a web map client that pans and zooms smoothly and shows places and routes. It also follows the user's location and works offline for saved areas.
Correctness contract: The map never shows a blank screen while data is loading, because a lower zoom tile always fills the gap. Every marker and route sits at its true coordinate at every zoom. The user's location is only read after the user grants permission, and it is never sent anywhere the user did not ask for.
You know basic HTML, CSS, JavaScript, and HTTP. You do not need to know WebGL or map math. Every term is explained below. Numbers are typical values for teaching, not measurements of any real product.
A map looks like one big picture that you drag around. It is not. The world at street level is far too big to download. At zoom 18 the world is cut into about 68 billion small squares. The client only ever loads the few dozen squares that fit on the screen. Most of the hard problems in this design come from one fact. The visible set of squares changes every frame while the user drags. Each new square must be fetched, decoded, uploaded to the GPU, and drawn without dropping a frame. On top of that sit the product features: search, markers, directions, the blue dot, and offline areas. This guide builds the client layer by layer and explains the numbers behind each choice.
The world is drawn as a square image. At zoom 0 the whole world fits in one tile. Each zoom level splits every tile into four children. So zoom z has 2^z by 2^z tiles. A tile is named by three numbers: z/x/y.
Example. Zoom 12 has 4,096 by 4,096 tiles. Central Paris is tile 12/2074/1409. Its four children at zoom 13 are 13/4148/2818, 13/4149/2818, 13/4148/2819, and 13/4149/2819.
Limit. The count grows by four each level. Zoom 18 has about 68.7 billion tiles. Nobody stores all of them as images. Servers render or cut tiles on demand and cache the popular ones.
Web Mercator projection
A projection turns a point on the round Earth into a point on a flat square. Web maps use Web Mercator (EPSG:3857). It keeps angles correct, so streets cross at the right angles. It stretches areas near the poles.
Example. The map is cut at latitude 85.0511 degrees north and south. This makes the world an exact square. Greenland looks as big as Africa, but it is 14 times smaller.
Limit. Distances on screen are not constant. One pixel at zoom 15 is about 4.8 meters at the equator but only 3.1 meters at Paris. Always compute real distances on the sphere, not in pixels.
Raster vs vector tiles
A raster tile is a finished picture, usually a 256 or 512 pixel PNG or JPEG. A vector tile holds geometry and attributes, such as road lines and building shapes. The client draws vector tiles itself with a style.
Example. A raster road tile looks blurry when you zoom between levels. A vector tile in the Mapbox Vector Tile format (protobuf) stays sharp at zoom 12.7. It can rotate with labels upright and switch to dark mode without a new download.
Limit. Vector tiles need CPU to decode and a GPU to draw. Satellite imagery is always raster. Very old devices may draw raster faster than they can decode vectors.
WebGL rendering
WebGL lets JavaScript send triangles and textures to the GPU. The GPU then draws millions of pixels in parallel. The main cost is not drawing. It is uploading data and the number of draw calls per frame.
Example. A city tile at zoom 15 may hold 40,000 triangles for buildings. The GPU draws that in well under a millisecond. Uploading the same buffer again every frame would waste time, so we upload it once and reuse it.
Limit. The browser can take the GPU context away at any time, for example when memory is low. The app must listen for webglcontextlost and rebuild its GPU state.
Marker clustering
When many points are close on screen, they merge into one cluster bubble with a count. Zooming in splits the bubble. Clusters are computed per zoom level, because nearness in pixels depends on zoom.
Example. 50,000 coffee shops at zoom 4 become about 120 bubbles. At zoom 16 only 30 single shops are in view, and no clustering is needed.
Limit. A cluster hides detail. A user who searches for one shop must still find it. Clicking a cluster should zoom to its bounds, and a list view should show every result.
1. Clarifying questions and requirements
Start by asking questions. Each answer cuts away part of the design. Good questions for a maps client:
Which platforms? Desktop web and mobile web. Native apps are out of scope, but mobile Safari and low-end Android are in scope.
Which layers? Road map and satellite. 3D buildings are nice to have. Live traffic is a colored layer on roads.
How many markers? Search results return up to a few hundred. A "show all stores" view may need 50,000 points.
Is turn-by-turn navigation in scope? Show the route and the step list. Full voice navigation is out of scope.
What does offline mean? The user saves a named area, such as a city, and can browse and search it later with no network.
Functional requirements
Pan, zoom, and rotate the map with mouse, touch, trackpad, and keyboard.
Switch between road and satellite layers.
Search places with autocomplete, and show results as markers and as a list.
Show directions between two points with alternatives, distance, and time.
Show the user's location as a blue dot with an accuracy circle, and follow it on request.
Download an area for offline use, and manage saved areas.
Non-functional requirements
60 fps while panning and zooming on a mid-range phone. No long task over 50 ms during a gesture.
First useful map in under 2.5 seconds on a 4G connection (Largest Contentful Paint).
Never show an empty grey square for more than one frame when a parent tile exists.
Stay under about 300 MB of total memory on mobile, or iOS Safari may kill the tab.
Accessible: keyboard control, screen reader friendly results, and respect for prefers-reduced-motion.
Location privacy: ask for permission only after a user action, and never store a location history without consent.
Interview
Say out loud which parts you will skip. "I will not design the tile server or the routing engine. I will treat them as APIs and focus on the client." This shows control of scope and buys time for the rendering deep dive.
2. Scope and budgets
Numbers turn vague goals into design choices. Work them out on the whiteboard.
Frame budget
At 60 Hz each frame has 16.7 ms. The browser needs a few milliseconds for its own work, such as compositing. That leaves about 10 ms for our JavaScript and GPU commands. On a 120 Hz screen the whole frame is 8.3 ms. So the target is "under 6 ms of main thread work per frame during a gesture". Anything heavier moves to a Web Worker.
Tiles on screen
A desktop viewport of 1,920 by 1,080 CSS pixels with 512 pixel vector tiles needs about 5 columns and 4 rows. Add one ring of margin for panning. That is about 20 to 35 tiles.
With 256 pixel raster tiles the same viewport needs about 9 by 6, so 54 tiles before margin.
A phone viewport of 390 by 844 CSS pixels at device pixel ratio 3 has 1,170 by 2,532 real pixels. Raster tiles must be the high density version (often called @2x), or the map looks blurry.
Network
A vector tile at mid zoom is 20 to 80 KB after gzip. A satellite JPEG tile is 30 to 60 KB.
A first view of 30 tiles at 50 KB is 1.5 MB. On a 4G link at 10 Mbps that is about 1.2 seconds. On 3G at 1.5 Mbps it is 8 seconds. So we must show the center tiles first and the edges later.
A fast fling across a city can request 200 tiles in two seconds. Most become useless before they arrive. We must cancel them with AbortController.
Memory
A 512 by 512 RGBA texture takes 1 MB on the GPU. One hundred raster tiles use 100 MB.
A decoded vector tile in dense city takes 0.5 to 2 MB of vertex and index buffers.
Budget on mobile: 64 to 96 MB for decoded tiles, 20 MB for glyph and icon atlases, the rest for the app. Desktop can use two to three times more.
Bundle
The map engine with WebGL code and a protobuf decoder is about 200 to 250 KB gzipped. That is too big for the critical path.
Plan: ship a 60 KB app shell first, then load the engine with a modulepreload hint. Show a static map image (one server-rendered PNG) as the first paint, then swap in the live canvas.
Load routing UI, offline manager, and street-level imagery as separate chunks on first use.
3. High-level architecture
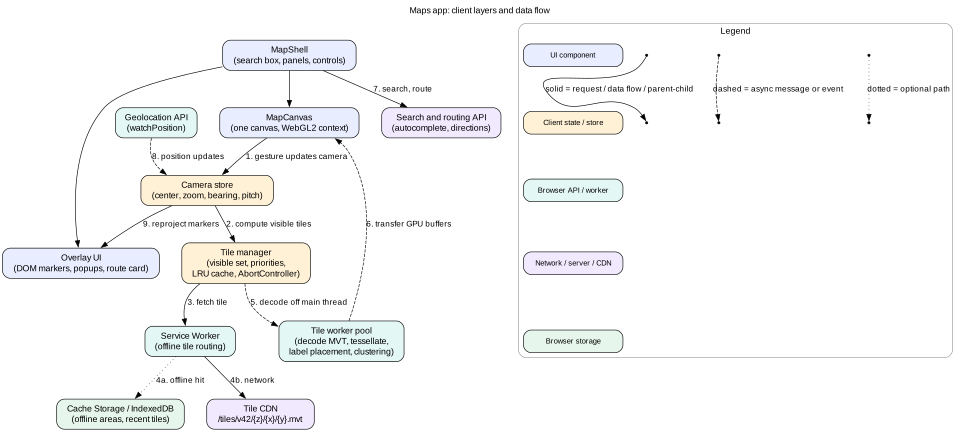
The client has four layers. The UI layer is React or a similar framework for panels, the search box, and buttons. The map engine owns one canvas and runs outside the framework render cycle. The data layer holds the camera, the tile manager, and the caches. The platform layer is the browser APIs: workers, the Service Worker, storage, and geolocation.
Figure 1. The map engine runs beside the UI framework, not inside it. Workers do the heavy decoding. The Service Worker decides between offline storage and the CDN.
Component tree
MapShell: the page layout. It holds the search box, the side panel, the layer switcher, and the zoom buttons.
MapCanvas: a thin component that creates the engine once and gives it a <canvas>. It never re-renders on camera change.
OverlayLayer: absolutely positioned DOM for a few rich markers, the info popup, and the route card. It reads the camera through a subscription, not through React props.
ResultsPanel: the list of search results. It is the accessible twin of the markers.
Why the engine lives outside React
A camera change happens up to 120 times per second. If each change went through React state, every subscribed component would re-render. That is too slow and gives no benefit. So the engine keeps the camera in a plain store. It draws in its own requestAnimationFrame loop. React components subscribe with useSyncExternalStore only for slow-changing facts, such as "the zoom level crossed 14" or "the selected place changed".
Intuition
Think of the map engine as a video game inside the page. Games do not ask a UI framework for permission to draw each frame. The UI framework is the menu screen around the game.
4. Data model
The client store has a few clear parts. Keep tile data out of the UI store. It is large and changes fast.
// Camera: one per map. Changes every frame during a gesture.
type Camera = {
  center: { lng: number; lat: number };
  zoom: number;        // fractional, for example 13.42
  bearing: number;     // degrees, 0 = north up
  pitch: number;       // degrees, 0 = flat
};

// Tile records in the tile manager, keyed by "z/x/y/source".
type TileState = "loading" | "decoding" | "ready" | "error";
type TileRecord = {
  key: string;                 // "14/8299/5636/roads"
  state: TileState;
  bytes: number;               // decoded size, for the LRU budget
  lastUsedFrame: number;
  abort?: AbortController;     // cancel when it leaves the wanted set
  buffers?: GpuBuffers;        // vertex and index buffers per layer
  retryAt?: number;
};

// Normalized UI entities.
type Place = { id: string; name: string; lng: number; lat: number;
               category: string; rating?: number };
type Route = { id: string; polyline: string;   // encoded polyline
               distanceM: number; durationS: number; stepIds: string[] };

type UiState = {
  places: Record<string, Place>;
  search: { query: string; resultIds: string[]; status: "idle" | "loading" | "done" | "error" };
  selectedPlaceId: string | null;
  routes: Record<string, Route>;
  activeRouteId: string | null;
  location: { lng: number; lat: number; accuracyM: number; at: number } | null;
  follow: boolean;
  offlineAreas: Record<string, { id: string; name: string; bbox: [number, number, number, number];
                               minZoom: number; maxZoom: number; tilesetVersion: string;
                               bytes: number; status: "queued" | "downloading" | "ready" | "stale" }>;
};
A few rules make this model correct:
Places are stored once by id. The marker layer, the results list, and the info card all read the same record. Selecting a place in the list highlights the marker without copying data.
Tile keys include the source and the tileset version. When the server publishes v43, old v42 tiles are never mixed with new style rules.
5. Interface and API
Tile endpoints
GET /tiles/v42/roads/{z}/{x}/{y}.mvt returns a vector tile. Headers: Content-Type: application/vnd.mapbox-vector-tile, Content-Encoding: gzip, and Cache-Control: public, max-age=31536000, immutable.
GET /tiles/sat/2025q3/{z}/{x}/{y}@2x.jpg returns a satellite tile for high density screens.
GET /styles/v42.json lists layers, colors, and the tile URL template. It has a short cache time, such as max-age=300, because it points to the current version.
The version is in the path. So every tile can be cached forever. A new release changes the path, not the cache headers. This is the same trick used for hashed JavaScript bundles.
Search and routing
GET /places/autocomplete?q=caf&bbox=2.25,48.81,2.42,48.90&session=abc returns up to 8 suggestions. The bbox biases results to what the user sees. The session token groups keystrokes into one billing session.
POST /directions with { origin, destination, mode, alternatives: true } returns up to three routes. Each has an encoded polyline, a distance, a duration, and steps.
The API is small on purpose. UI code never touches tiles or GPU buffers. That boundary lets us swap the renderer, for example to a raster fallback, without changing the panels.
6. Deep dive: from tile bytes to pixels
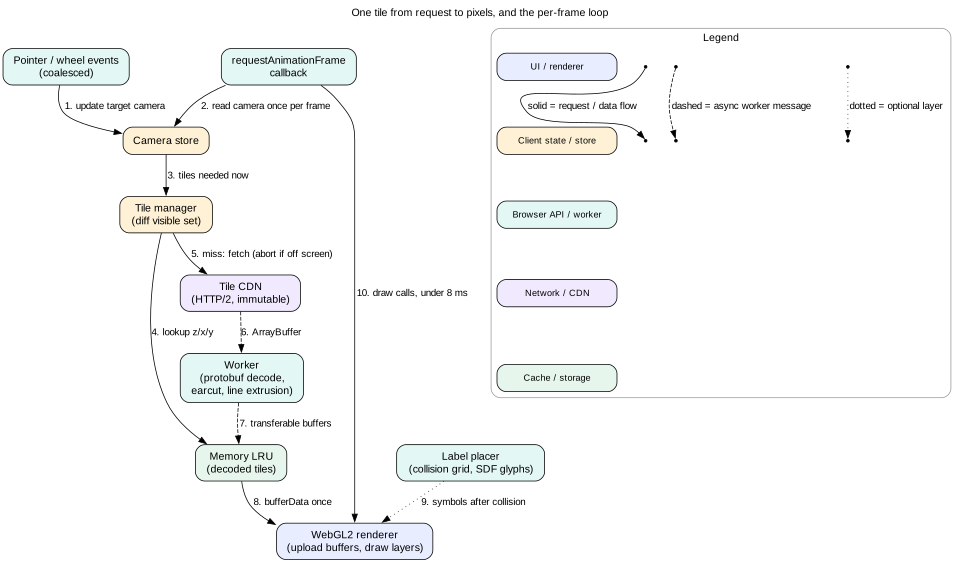
Figure 2. The frame loop only reads state and draws. Fetching and decoding happen in parallel and finish whenever they finish.
Step 1: decide which tiles are wanted
Each frame, the tile manager turns the camera into a set of tile keys. It uses the integer zoom floor(zoom). At zoom 13.4 it loads zoom 13 tiles and scales them by 2^0.4, about 1.32. When the map is tilted, far tiles cover more ground, so the manager uses lower zoom tiles near the horizon. It sorts the wanted tiles by distance from the screen center. The center loads first because that is where the user looks.
Step 2: fetch with priorities and cancellation
Use fetch with an AbortController per tile. When a tile leaves the wanted set before it arrives, call abort(). This frees the connection for useful tiles.
Limit to about 16 tiles in flight. HTTP/2 multiplexes many requests on one connection, but the server and the radio still have limits.
Step 3: decode in a worker
A vector tile is protobuf. Decoding it, cutting polygons into triangles, and turning lines into thick ribbons can take 10 to 40 ms per tile on a phone. That would freeze the main thread. So a pool of two to four workers does it. A good pool size is navigator.hardwareConcurrency - 1, capped at 4.
Polygons become triangles with an ear clipping algorithm, such as earcut.
Lines become two triangles per segment, with extra vertices at joins and caps.
The worker builds typed arrays, such as Float32Array and Uint16Array.
It sends them back with postMessage(result, [buffer1, buffer2]). The second argument lists transferable objects. Transfer moves ownership with no copy, so a 2 MB buffer costs almost nothing to send.
Step 4: upload once, draw many times
The main thread calls gl.bufferData once per tile layer. After that, each frame only sets a few uniforms, such as the tile's offset and scale, and issues draw calls. A typical frame draws 30 tiles times 10 layers, so about 300 draw calls. WebGL2 vertex array objects keep the state switch cheap. Merging layers with the same shader cuts calls further.
Step 5: labels
Labels are the hardest part of map rendering. Text must stay upright, must not overlap, and must not jump while you pan.
Glyphs are drawn from a signed distance field (SDF) atlas. One small texture holds each letter as a distance map. The shader can draw it sharp at any size and add a halo for contrast.
A collision grid on screen space decides which labels fit. Higher priority labels, such as city names, are placed first.
Placement runs every few frames, not every frame. Labels fade in over 200 ms, so small changes do not flicker.
Never show a blank square
When a zoom 14 tile is not ready, draw its zoom 13 parent, scaled up and clipped to the child's area. When zooming out, draw the four zoom 15 children if they are cached. Use the stencil buffer so a parent and its child never draw on top of each other. This is why the correctness contract can promise no empty squares.
Mistake
Parsing tiles on the main thread "because it is fast on my laptop". A MacBook decodes a tile in 3 ms. A low-end Android phone takes 30 ms. Ten tiles arriving together cause a 300 ms freeze in the middle of a gesture.
7. Deep dive: panning and zooming at 60 fps
Input handling
Use Pointer Events (pointerdown, pointermove, pointerup) for mouse, touch, and pen with one code path.
Set touch-action: none on the canvas. Without it, the browser may scroll the page or zoom the whole page instead of the map.
Call setPointerCapture on pointerdown. The drag continues even if the finger leaves the canvas.
For the wheel, add the listener with { passive: false } so you can call preventDefault(). Trackpad pinch arrives as a wheel event with ctrlKey set to true.
Two active pointers mean a pinch. Zoom change is log2(newDistance / oldDistance). Rotation is the change in angle between the two fingers.
Decouple input from drawing
Input events can fire more often than frames. A gaming mouse sends 1,000 events per second. The handler should only update a target camera and set a "dirty" flag. The requestAnimationFrame callback reads the latest camera once and draws. So 16 move events in one frame cost one draw, not 16. PointerEvent.getCoalescedEvents() gives the in-between points if you need them for smooth inertia.
Zoom around the pointer
When the user zooms with the wheel, the point under the cursor must stay under the cursor. Convert the cursor to world coordinates before the zoom. Change the zoom. Then move the center so the same world point lands under the cursor again. Getting this wrong makes the map "slide away", and users notice at once.
Avoid layout work
The canvas size changes only on resize. Watch it with ResizeObserver and set canvas.width = clientWidth * dpr.
DOM markers move with transform: translate3d(x, y, 0), never with top and left. Transforms run on the compositor without layout.
8. Deep dive: tile cache and eviction
There are three cache levels. Saved offline areas are the third level, covered in section 11. This section covers the first two.
Level 1: GPU and memory cache
This holds decoded tiles with their GPU buffers. It is the fastest level, because a hit needs no work at all. It is also the most expensive, because GPU memory is small on phones. Use an LRU with a byte budget. Measure each tile's size as the sum of its buffer sizes.
Pin all tiles in the current visible set and their fallback parents. Pinned tiles are never evicted.
On eviction, call gl.deleteBuffer. Forgetting this leaks GPU memory until the context is lost.
Level 2: HTTP cache
Because tile URLs are versioned and marked immutable, the browser HTTP cache serves repeat visits with no network. This is free and needs no code. But the browser may evict it at any time, and you cannot list or control it.
Working out the budget
Visible set: about 35 tiles. Parents for fallback: about 10 more.
Room for panning back and zooming back: about 3 screens of history, so about 100 tiles.
At 0.8 MB average decoded size, 150 tiles need 120 MB. That is too much for a low-end phone. On those devices, cap at 60 MB and drop the history to one screen.
Memory pressure
Browsers do not tell you how much GPU memory is free. Signals you can use:
A webglcontextlost event means you were already over the limit. Shrink the budget by half before you rebuild.
When the page becomes hidden (visibilitychange), drop the non-visible part of the cache. iOS kills background tabs that hold a lot of memory.
9. Deep dive: markers and clustering
DOM markers vs GPU markers
DOM markers are normal elements positioned over the canvas. They are easy to style, can hold buttons, and screen readers see them. Each one costs a style and composite update per frame while the map moves. Good up to about 200.
GPU markers are drawn as sprites in WebGL from an icon atlas. Ten thousand of them cost one draw call. They need custom hit testing and are invisible to assistive technology.
Clustering
Clustering groups points that are within a radius, such as 60 pixels, at a given zoom. A common method builds a hierarchy once, for zoom 0 to the max zoom:
Start at the max zoom with every point as its own cluster.
For the next zoom out, put clusters in a spatial index, such as a KD-tree. Merge each cluster with its neighbors inside the radius.
The new cluster's position is the weighted center of its members. Its count is the sum.
Repeat up to zoom 0. Store the clusters per zoom.
For 50,000 points this takes about 100 to 200 ms. Run it in a worker. After that, a query for "clusters in this bbox at zoom 11" takes under 1 ms. The marker layer asks for clusters each time the integer zoom or bbox changes.
Markers and accessibility
A canvas has no structure for screen readers. So every marker set must also exist as a list. The results panel is an <ol> of buttons. Focusing a result highlights its marker and pans the map if needed. Announce changes, such as "12 results in view", through an aria-live="polite" region.
10. Deep dive: search, routing, and geolocation
Autocomplete
Debounce keystrokes by about 150 ms. Shorter wastes requests. Longer feels slow.
Cancel the previous request with AbortController on each new keystroke. Without this, a slow answer for "ca" can arrive after the answer for "caf" and overwrite it. As a second guard, drop any response older than the latest one shown.
Use the combobox pattern: an input with role="combobox", aria-expanded, and aria-activedescendant, plus a role="listbox" of options. Arrow keys move, Enter selects, and Escape closes.
Routing
The server returns an encoded polyline. This format packs coordinates into a short string, often 5 to 10 times smaller than JSON arrays. Decode it in a worker if the route is long.
Draw the route as a line layer above roads and below labels. Draw alternatives in grey. Clicking an alternative makes it active.
Geolocation
The Geolocation API works only in a secure context (HTTPS). It asks the user for permission the first time.
Do not ask on page load. Ask when the user taps "show my location". A request with no context is often denied, and a denial is hard to undo.
Check the current state first with navigator.permissions.query({ name: "geolocation" }). If it is "denied", show help text instead of calling the API again.
Use watchPosition with { enableHighAccuracy: true, maximumAge: 5000, timeout: 15000 } while following. Each update has coords.accuracy in meters. Draw that as a translucent circle.
Call clearWatch when the page is hidden or when the user stops following. GPS drains the battery.
Interview
Mention the race condition in autocomplete without being asked. It is a classic senior signal. Explain both fixes: abort the old request, and ignore stale responses by sequence number.
11. Deep dive: offline areas and low-end devices
How big is an offline area?
Take a city box of 20 by 20 km. At zoom 16, one tile is about 611 m wide at the equator, and narrower at higher latitudes. So the box needs about 33 by 33 tiles, which is 1,090 tiles. All lower zooms add about one third more, because each level has a quarter of the tiles of the next. So zoom 0 to 16 is about 1,450 tiles. At 40 KB each that is about 58 MB. Adding zoom 17 would multiply by four. Most apps stop at 16 and overzoom the vector data for closer views.
Download flow
The user draws or picks an area. The UI shows the estimated size before download starts.
Check space with navigator.storage.estimate(). If quota - usage is too small, ask the user to pick a smaller area.
Call navigator.storage.persist(). If granted, the browser will not evict this data under storage pressure.
A download queue fetches tiles with 4 to 6 in parallel. It writes each tile to Cache Storage under its versioned URL.
Progress is saved in IndexedDB after each batch. If the tab closes, the download resumes from the last batch.
When done, the area record switches to "ready". It also stores the place search index for that area, a small file of names and coordinates.
Serving offline
A Service Worker listens for fetch events on /tiles/. It looks in Cache Storage first. If it finds the tile, it returns it. If not, it goes to the network. When the network fails and no tile is cached, the engine draws the parent tile. The user sees a blurrier map instead of a hole.
Keeping offline data fresh
Each area stores its tileset version. When a new version ships, mark the area "stale" and offer an update. Keep serving the old version until the update finishes.
Low-end devices
The same app must run on a 2 GB Android phone and a desktop with a big GPU. Detect capability early and pick a quality tier:
Create the WebGL context with failIfMajorPerformanceCaveat: true. If it fails, the device uses software rendering. Switch to raster tiles drawn on a 2D canvas or even plain <img> tiles.
Low tier: cap device pixel ratio at 1.5, disable 3D buildings and pitch, show fewer labels, use one worker, halve the tile cache.
Measure real frame times for the first few seconds. If the median frame is over 20 ms, drop a tier at runtime.
Tip
Device pixel ratio is the biggest lever. Going from DPR 3 to DPR 2 cuts pixels to fill by more than half. Most users cannot see the difference on a moving map.
12. Failure modes
Tile request fails (5xx or timeout). Draw the parent tile. Retry with exponential backoff: 1 s, 2 s, 4 s, then stop. Retry again when the tile is wanted after a later pan.
WebGL context lost. Stop the frame loop. Clear all GPU references but keep decoded CPU data if memory allows. Listen for webglcontextrestored, rebuild shaders and buffers, and resume. If it fails twice, switch to the raster fallback.
Out of memory on iOS. The tab reloads with no warning. Prevent it with budgets and by trimming caches on visibilitychange. Save the camera to sessionStorage so a reload restores the view.
Storage quota exceeded during offline download. Catch QuotaExceededError, pause the queue, mark the area as partial, and tell the user how much space is needed.
13. Trade-offs
Raster tiles vs vector tiles
Raster: simple client, works everywhere, cheap CPU. But blurry between zooms, no rotation with upright labels, a new download for each style or language, and @2x tiles are four times the bytes.
Vector: sharp at every zoom, restyle on the client, labels in any language, often 30 to 50 percent fewer bytes. But it needs WebGL, workers, and a much bigger engine bundle.
Choice: vector for the road map, raster for satellite, raster fallback for weak devices.
14. 45-minute interview walkthrough
Minutes 0 to 5: clarify. Platforms, layers, marker counts, offline meaning, what is out of scope. Write functional and non-functional lists.
Minutes 5 to 10: budgets. 16 ms frame, about 30 tiles per screen, 1.5 MB first view, about 100 MB tile memory on mobile, 250 KB engine bundle.
Minutes 10 to 17: architecture. Draw the shell, the engine outside React, the tile manager, workers, the Service Worker, and the CDN. Explain why the camera is not React state.
Minutes 17 to 22: data model and API. Tile keys with versions, normalized places and routes, immutable tile URLs, the small engine API.
Minutes 22 to 32: rendering and gestures. Visible set, priorities, abort, worker decode, transferables, upload once, parent fallback, rAF loop, zoom around cursor.
Minutes 32 to 37: one product deep dive. Pick what the interviewer cares about: clustering, search races, or offline areas with quota math.
Minutes 37 to 41: failures and low-end devices. Context loss, memory kills, quality tiers, raster fallback.
Minutes 41 to 45: trade-offs and summary. Raster vs vector, DOM vs GPU markers. Name what you would measure in production: frame time, tile latency, blank tile rate.
15. Summary
The world is a pyramid of tiles named z/x/y. The client loads only the few dozen tiles on screen, center first.
The map engine runs its own requestAnimationFrame loop outside the UI framework. Input only updates a camera. The loop reads it once per frame.
Workers decode vector tiles and transfer typed arrays with no copy. The main thread uploads each buffer to the GPU once.
A byte-budget LRU with pinned visible tiles, plus parent fallback, keeps memory bounded and the screen never blank.
Markers go to the GPU at scale, with clustering per zoom and an accessible list as the twin.
16. Common mistakes
Storing the camera in React state and re-rendering the tree on every frame.
Decoding tiles on the main thread.
Never cancelling tile requests, so a fling floods the network with useless work.
An LRU that counts entries instead of bytes, or that evicts visible tiles.
Asking for location permission on page load.
Treating the canvas as accessible. Screen readers see nothing inside it without a parallel list.
Short cache headers on tiles instead of versioned URLs with immutable.
Worked example: a pinch zoom over Paris
A user on a mid-range Android phone (4 cores, DPR 2.75, capped to 2) is at zoom 12 over central Paris. They pinch out to zoom 14 in about 600 ms.
Two fingers touch. About 70 pointermove events arrive over 600 ms. Each one computes the new finger distance, sets targetZoom = startZoom + log2(d / d0), keeps the midpoint fixed in world space, and marks the camera dirty. No drawing happens in the handler.
Each requestAnimationFrame callback, about 36 in total, reads the latest camera. At zoom 12.0 to 12.99 it keeps drawing zoom 12 tiles, scaled up to 2 times. The view stays sharp enough because these are vector tiles.
When the zoom crosses 13.0, the tile manager computes a new wanted set of 24 zoom 13 tiles. It finds 4 in the memory cache from an earlier visit. It starts 16 fetches, sorted by distance from the pinch midpoint, and queues 4.
Until a zoom 13 tile is ready, its zoom 12 parent is drawn in its place, clipped by the stencil buffer. The user sees a soft map, never a hole.
Tiles arrive from the CDN in 80 to 200 ms. Each ArrayBuffer goes to one of three workers. Decoding takes about 15 ms each in the worker. The main thread is not blocked.
The zoom crosses 14.0 before all zoom 13 tiles are done. The manager aborts 7 zoom 13 requests that are still in flight. It starts zoom 14 requests for the center first.
Workers transfer back typed arrays. The main thread calls gl.bufferData for each ready tile, about 0.3 ms each, and spreads uploads so no frame does more than 4 uploads.
The fingers lift. The engine fires idle after all wanted tiles are ready. Only now does React update the zoom indicator.
Code lab: tile math and an LRU tile cache
This script converts a longitude and latitude to a tile. It lists the tiles in a viewport, center first. Then it caches them in a byte-budget LRU that never evicts visible tiles. Save it as tiles.mjs and run node tiles.mjs with Node 18 or later. No packages are needed.
const MAX_LAT = 85.05112878;

function lonLatToTile(lon, lat, z) {
  const n = 2 ** z;
  const rad = (Math.max(-MAX_LAT, Math.min(MAX_LAT, lat)) * Math.PI) / 180;
  const x = Math.floor(((lon + 180) / 360) * n);
  const y = Math.floor(((1 - Math.log(Math.tan(rad) + 1 / Math.cos(rad)) / Math.PI) / 2) * n);
  return { x: Math.min(n - 1, Math.max(0, x)), y: Math.min(n - 1, Math.max(0, y)), z };
}

function visibleTiles(center, z, widthPx, heightPx, tileSize = 256) {
  const c = lonLatToTile(center.lon, center.lat, z);
  const n = 2 ** z;
  const halfCols = Math.ceil(widthPx / tileSize / 2);
  const halfRows = Math.ceil(heightPx / tileSize / 2);
  const out = [];
  for (let dy = -halfRows; dy <= halfRows; dy++) {
    for (let dx = -halfCols; dx <= halfCols; dx++) {
      const y = c.y + dy;
      if (y < 0 || y >= n) continue;
      const x = (((c.x + dx) % n) + n) % n; // wrap at the antimeridian
      out.push({ key: `${z}/${x}/${y}`, dist: dx * dx + dy * dy });
    }
  }
  return out.sort((a, b) => a.dist - b.dist).map((t) => t.key); // center first
}

class TileCache {
  constructor(maxBytes) { this.maxBytes = maxBytes; this.bytes = 0; this.map = new Map(); }
  get(key) {
    const e = this.map.get(key);
    if (!e) return undefined;
    this.map.delete(key); this.map.set(key, e); // move to most recent
    return e.data;
  }
  set(key, data, size, pinned = new Set()) {
    if (this.map.has(key)) { this.bytes -= this.map.get(key).size; this.map.delete(key); }
    this.map.set(key, { data, size }); this.bytes += size;
    for (const [k, e] of this.map) { // Map keeps insertion order: oldest first
      if (this.bytes <= this.maxBytes) break;
      if (pinned.has(k)) continue; // never evict a tile on screen
      this.map.delete(k); this.bytes -= e.size;
    }
  }
}

const paris = { lon: 2.3522, lat: 48.8566 };
console.log("tile at z12:", lonLatToTile(paris.lon, paris.lat, 12));
const cache = new TileCache(2_000_000); // 2 MB budget, 50 tiles of 40 KB
for (const z of [12, 13, 14]) {
  const keys = visibleTiles(paris, z, 1280, 720);
  const pinned = new Set(keys);
  for (const k of keys) if (!cache.get(k)) cache.set(k, `tile ${k}`, 40_000, pinned);
  console.log(`z${z}: ${keys.length} visible, cache ${cache.map.size} tiles, ${cache.bytes} bytes`);
}
console.log("oldest kept:", [...cache.map.keys()].slice(0, 3));
Expected output: tile { x: 2074, y: 1409, z: 12 }, then 35 visible tiles per zoom. The cache grows to 50 tiles and stays at 2,000,000 bytes. The oldest kept tiles are from zoom 13, because all zoom 12 tiles were evicted first. Try these changes:
Set the budget to 1,000,000 bytes. The cache now holds 35 tiles at 1,400,000 bytes, over budget. Pinning wins over the budget. This is why the visible set must fit, and why low-end devices lower DPR.
Check yourself
Why does the camera not live in React state?Answer
It changes up to 120 times per second during a gesture. Putting it in React state would re-render subscribed components every frame for no visual gain. The engine keeps it in a plain store and draws in its own rAF loop. It tells React only about slow changes, such as crossing a zoom level.
What does the second argument of postMessage(result, [buffer]) do, and why does it matter for tiles?Answer
It transfers ownership of the ArrayBuffer to the receiver instead of copying it. A 2 MB vertex buffer moves from the worker to the main thread in near zero time. Without transfer, the structured clone copy would cost milliseconds per tile on the main thread.
A user zooms from 13 to 14 and a zoom 14 tile is not ready. What do you draw?Answer
Draw the cached zoom 13 parent, scaled up by 2 and clipped to the child's area with the stencil buffer. If the parent is also missing, walk up to the grandparent. This keeps the "never blank" contract.
Your offline area is 20 by 20 km at zoom 0 to 16 and is about 58 MB. Product asks for zoom 17. What happens?Answer
Zoom 17 alone has four times the tiles of zoom 16, so about 4,400 more tiles. The total grows to roughly 230 MB. A better option is to stop at 16 and overzoom vector tiles for closer views.
Name two ways to stop a slow autocomplete response from overwriting a newer one.Answer
Abort the old request with AbortController when a new keystroke arrives. Also tag each request with an increasing sequence number and drop any response whose number is lower than the latest one shown.
The WebGL context is lost on a phone. What should the app do?Answer
Call preventDefault() in the webglcontextlost handler so restore is possible. Stop the frame loop, drop GPU references, and halve the cache budget. On webglcontextrestored, rebuild shaders and re-upload buffers. If it happens again, switch to the raster fallback.
Key terms
Tile pyramid
The set of all zoom levels, where each tile at zoom z has four children at zoom z + 1.
Web Mercator
The projection used by web maps (EPSG:3857). It keeps angles true and stretches areas near the poles.
Vector tile
A tile that holds geometry and attributes, often in the Mapbox Vector Tile protobuf format, drawn by the client.
Raster tile
A tile that is a finished image, such as a PNG or JPEG.
Overzoom
Drawing a tile from a lower zoom at a higher zoom, by scaling its vector geometry up.
Device pixel ratio (DPR)
Real screen pixels per CSS pixel. A DPR of 3 means nine real pixels per CSS pixel.
Transferable
An object, such as an ArrayBuffer, that can move between threads with no copy.
SDF glyph
A letter stored as a signed distance field, so the GPU can draw it sharp at any size.
Clustering
Merging nearby markers into one bubble with a count, computed per zoom level.
Context loss
When the browser takes away a WebGL context, usually under memory pressure, and all GPU objects become invalid.