A frontend system design guide for a data grid that feels like a spreadsheet. You will learn how to show millions of cells at 60 frames per second and how to edit them with the keyboard. You will also see how formulas recalculate without freezing the page.
Frontend system design · Large data and rendering
Design a grid that scrolls smoothly through a very large dataset. It supports editing, range selection, copy and paste, sorting, filtering, and formulas, and it stays usable with a keyboard and a screen reader.
Correctness contract: The grid always shows the right value in the right cell after scroll, sort, filter, or edit. A committed edit is never lost or applied to the wrong row. Formulas never show a stale result as if it were final. Keyboard focus always sits on a real, visible cell.
You know HTML, CSS layout, JavaScript, and a framework like React. You do not need to know spreadsheet engines. Excel, Google Sheets, and AG Grid are used only to frame the problem. This is a teaching design. Numbers are rough estimates.
A data grid is the classic test of whether a frontend engineer understands the browser's limits. A naive table with 100,000 rows and 30 columns creates 3 million DOM cells. The page takes many seconds to render and then scrolls like a slideshow. The fix is virtualization: render only the cells in view and recycle them as the user scrolls. But virtualization breaks things the browser used to do for you, like find-in-page, focus, selection, and screen reader navigation. So you have to rebuild them on purpose. On top of that, a spreadsheet adds formulas, which turn cells into a dependency graph that must be recalculated quickly and in the right order. This guide covers the rendering core first, then interaction, then data operations, and ends with scale and accessibility.
Virtualization renders only the rows and columns inside the viewport plus a small overscan. A spacer element gives the scroll container its full height, so the scrollbar looks right. As the user scrolls, the grid moves and reuses the same small set of cell elements.
Example. A 1,000,000 row grid with 32 pixel rows shows 25 rows on screen. With 5 rows of overscan above and below, it renders 35 rows, not a million.
Limit. Rows that are not rendered do not exist in the DOM. Browser find, native focus order, and screen readers cannot reach them without extra work.
Model index versus view index
The model index is a row's position in the source data. The view index is its position after sorting and filtering. The grid keeps a mapping array from view index to model index.
Example. After sorting by price, view row 0 might be model row 812. An edit in view row 0 must update model row 812.
Limit. Every edit, selection, and paste must translate between the two. Mixing them up is the most common source of "edited the wrong row" bugs.
Active cell and range selection
The active cell is the one cell with keyboard focus. A selection is one or more rectangular ranges. Each range has an anchor, where it started, and a focus, where it ends now.
Example. Click B2, then Shift+click D5. The range is B2 to D5 with anchor B2. Ctrl+click F1 adds a second range.
Limit. Store ranges as coordinates, never as sets of cell objects. Selecting a whole column in a million row sheet must cost a few numbers, not a million entries.
Dependency graph
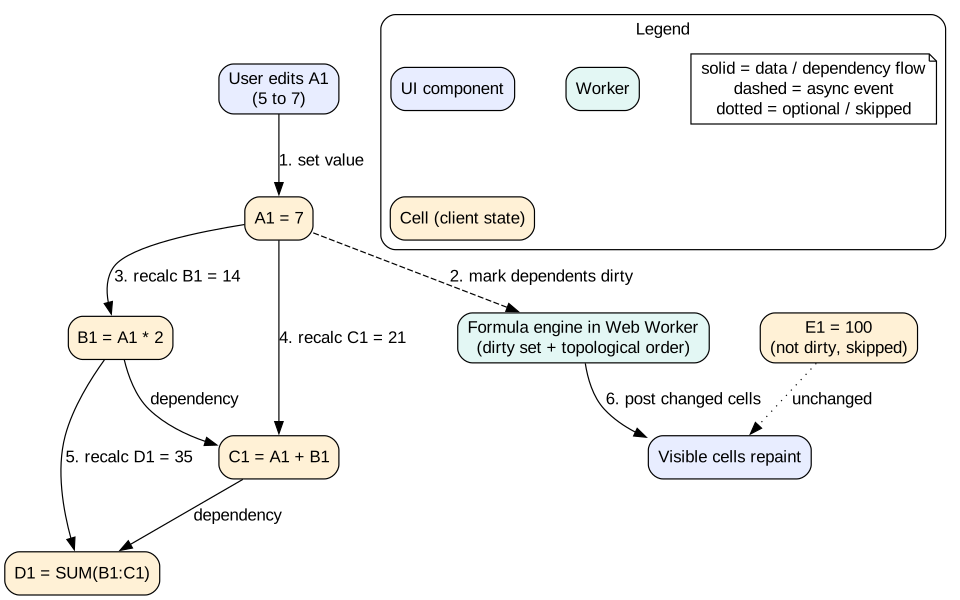
Each formula cell depends on the cells it references. These links form a directed graph. When a cell changes, only cells downstream of it need recalculation, and they must run in topological order so inputs are ready first.
Example. C1 is A1 + B1 and B1 is A1 * 2. Changing A1 must recalculate B1 before C1.
Limit. A cycle like A1 referring to B1 and B1 referring to A1 has no order. The engine must detect it and show an error.
DOM rendering versus canvas rendering
DOM grids render each visible cell as an element. Canvas grids draw text and lines on a <canvas> with the 2D context. Canvas avoids style and layout costs for thousands of cells.
Example. A full-screen 4K view can show 60 rows by 40 columns, which is 2,400 cells. That is fine for DOM. At 200 by 100 after zooming out, canvas is much faster.
Limit. Canvas has no built-in text selection, accessibility tree, or links. You must add an accessible DOM layer next to it.
1. Clarifying questions and requirements
Data grid or full spreadsheet? A data grid shows records with typed columns. A spreadsheet has free-form cells and formulas. The answer changes the data model.
How many rows and columns? 10,000 rows fit in memory easily. 10 million rows must stay on the server.
Is the data editable? Editing adds validation, optimistic saves, and conflict handling.
Do we need real-time collaboration? If yes, the edit model must be operation based. Treat it as a follow-up.
Variable row heights? Wrapped text makes virtualization math harder.
Which devices? Desktop first. Touch needs different selection handles.
Functional requirements
Display a large table with a fixed header row and optional frozen columns on the left.
Scroll vertically and horizontally through all rows and columns.
Select a cell, a range, whole rows, and whole columns with mouse and keyboard.
Edit cells inline with type-specific editors: text, number, date, and dropdown.
Copy and paste ranges, compatible with Excel and Google Sheets.
Sort by one or more columns and filter by column values.
Resize, reorder, and hide columns.
For spreadsheet mode, formulas with references like =SUM(B2:B100).
Non-functional requirements
Scroll at 60 frames per second with no blank flashes on a mid-range laptop.
Initial render of the first screen under 500 ms after data arrives.
Keystroke to visible cell change under 50 ms.
Sort or filter 1 million client-side rows in under 1 second without freezing the UI.
Memory under 500 MB for 1 million rows by 20 columns in client mode.
Fully operable by keyboard and announced by screen readers using the ARIA grid pattern.
2. Scope and budgets
DOM size
A 1080 pixel tall viewport with 32 pixel rows shows about 34 rows. A 1920 pixel wide viewport with 120 pixel columns shows about 16 columns.
With overscan of 6 rows and 2 columns on each side, the grid renders 46 rows by 20 columns, which is 920 cells. Add headers and you stay under 1,500 DOM nodes.
Without virtualization, 100,000 rows by 30 columns is 3 million cells. At even 1 microsecond per node for style and layout, a single relayout costs 3 seconds.
Frame budget
Each frame has 16 ms. Scroll handling, computing the visible window, updating cell content, and the browser's style, layout, and paint must all fit. Aim for under 4 ms of your own JavaScript per scroll frame. Updating 920 cells by changing textContent costs about 1 to 3 ms. Re-rendering them through a framework diff can cost 10 ms or more. So the hot path should avoid full framework renders.
Memory
1 million rows by 20 columns is 20 million values. As JavaScript objects with string keys, each row costs maybe 400 to 800 bytes. That is 400 to 800 MB, which is too much.
Store columns as typed arrays where possible. A Float64Array of 1 million numbers is 8 MB. 20 numeric columns are 160 MB. Strings can use a dictionary encoding: an Int32Array of IDs plus a small array of unique values.
Past about 1 to 5 million rows, keep data on the server and load row blocks on demand.
Scroll height limit
Browsers cap element height. Chrome allows about 33 million pixels, and Firefox less, about 17 million. With 32 pixel rows, 1 million rows need 32 million pixels, right at the limit. For more rows, scale the scroll position. Map scroll offset to row index with a factor, so the spacer stays below the cap.
3. High-level architecture
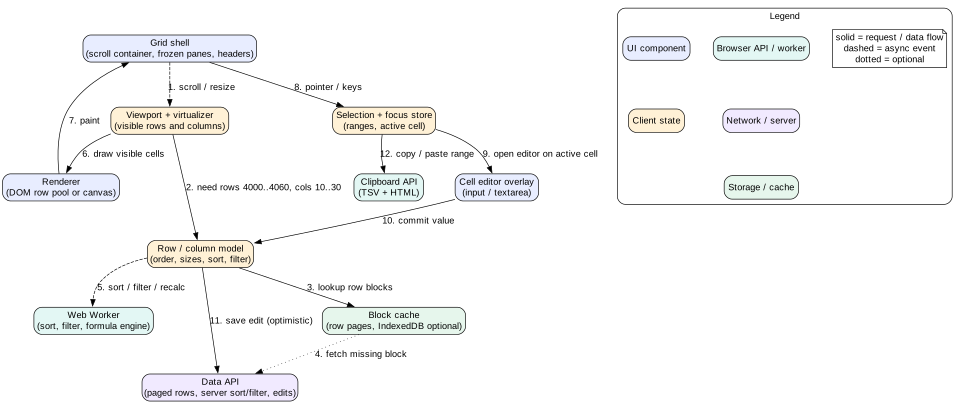
Figure 1. Grid layers. The virtualizer decides what is visible. The model decides what data is there. The renderer only draws.
Layers
Grid shell. A scroll container with a spacer for full size, sticky header row, frozen column pane, and the cell layer.
Virtualizer. Turns scroll position and viewport size into a visible row range and column range. It uses prefix sums of row heights and column widths.
Row and column model. Holds column definitions, order, widths, hidden flags, sort and filter state, and the view-to-model index map.
Data source. Either all rows in memory, or a server-backed source that loads blocks of rows, for example 200 at a time.
Renderer. A pool of row elements, or a canvas. It only draws what the virtualizer gives it.
Selection and focus store. The active cell, the list of ranges, and the edit state.
Cell editor. One floating input placed over the active cell when editing. It is not inside every cell.
Worker. Runs sorting, filtering, aggregation, and the formula engine off the main thread.
Intuition
Think of the grid as a camera moving over a huge sheet of paper. The paper is the data model. The camera is the viewport. You only paint what the camera sees, and you paint it again when the camera moves.
4. Data model
type ColumnDef = {
  id: string
  header: string
  type: 'text' | 'number' | 'date' | 'enum' | 'bool'
  width: number
  frozen?: boolean
  editable?: boolean
  validate?: (v: unknown) => string | null   // error message or null
  format?: (v: unknown) => string             // display, e.g. Intl.NumberFormat
}

type CellAddr = { row: number; col: number }   // view coordinates
type Range = { anchor: CellAddr; focus: CellAddr }

type GridState = {
  columns: Record<string, ColumnDef>
  columnOrder: string[]                     // visible order, frozen first
  rowCount: number                          // total in view after filter
  viewToModel: Int32Array                   // view row -> model row
  sort: { colId: string; dir: 'asc' | 'desc' }[]
  filters: Record<string, FilterSpec>
  rowHeights?: Float32Array                 // only if variable
  selection: { ranges: Range[]; active: CellAddr }
  editing: { cell: CellAddr; draft: string } | null
  pendingEdits: Record<string, { value: unknown; status: 'saving' | 'error' }>   // key = modelRow:colId
}

// Columnar storage for client mode
type ColumnData =
  | { kind: 'number'; values: Float64Array; nulls?: Uint8Array }
  | { kind: 'dict'; ids: Int32Array; dict: string[] }

// Spreadsheet mode adds formulas
type FormulaCell = { src: string; ast: Ast; deps: string[]; value: unknown; error?: string }
type SheetState = {
  cells: Map<string, unknown | FormulaCell>   // sparse, key = "B12"
  dependents: Map<string, Set<string>>      // reverse edges for recalc
}
Three choices matter. Selection uses coordinates, not cell objects, so selecting a whole column is cheap. Pending edits are keyed by model row and column ID, not view position, so a re-sort cannot move an edit to the wrong row. Spreadsheet cells are stored sparsely in a map, because most of a 1,000 by 26 sheet is empty.
5. Interface and API
Server API for large datasets
GET /api/tables/:id/schema returns columns and the total row count.
POST /api/tables/:id/rows/query with { offset, limit, sort, filters } returns a block of rows. The client asks for blocks of 100 to 500 rows around the viewport.
PATCH /api/tables/:id/rows/:rowId with { colId, value, baseVersion } saves one edit. It returns 409 if the row changed since baseVersion.
POST /api/tables/:id/rows/batch saves many edits at once, for paste. It is atomic and accepts an idempotency key.
GET /api/tables/:id/distinct?col=status returns distinct values for the filter menu.
Use stable row IDs, not offsets, as identity. Offsets change when rows are inserted or filtered. For live data, a WebSocket or EventSource channel pushes row changes with their IDs. The client patches cached blocks and repaints only visible cells.
The DataSource interface hides whether data is local or remote. The virtualizer asks for a range and gets either rows or a promise. While a block loads, the grid shows placeholder rows with a skeleton so the layout never jumps.
6. Deep dive: row and column virtualization, frozen panes
Computing the visible window
With a fixed row height h, the first visible row is floor(scrollTop / h) and the count is ceil(viewportHeight / h) + 1. Add overscan of 3 to 10 rows on each side. With variable heights, keep a prefix sum array, where offset[i] is the top of row i. Find the first visible row with a binary search over offset, which is O(log n). Columns work the same way with widths.
When heights are unknown until render, as with wrapped text, use an estimated height first. Measure rows after they render with a ResizeObserver. Update the prefix sums and adjust scrollTop by the difference above the viewport, so the content under the user's eyes does not jump.
Positioning rows
Put a spacer inside the scroll container with the full height and width. This gives native scrollbars and momentum scrolling.
Place the visible rows with transform: translateY(...) rather than top. Transforms can be composited and avoid layout for the moving part.
Keep a pool of row elements. When a row scrolls out, reuse its element for the row that scrolls in. Update only textContent and a few attributes.
Give cells fixed sizes and use contain: strict on the cell layer. Then a change inside one cell does not trigger layout for the whole page.
Avoiding blank flashes
Scroll events are asynchronous. The browser can scroll the compositor layer before your JavaScript renders new rows, so the user sees blank space for a frame. Overscan hides small jumps. For fast flings, read the scroll position in a requestAnimationFrame loop while scrolling is active. Render based on scroll velocity, with more overscan in the direction of travel. Do not render inside the scroll handler with heavy work. Schedule it in the next frame and coalesce many scroll events into one render.
Mistake
Rendering each row as a React component and letting React reconcile 1,000 cells on every scroll frame. It looks fine with 10 columns on a fast laptop and drops to 20 frames per second on real hardware. Keep the cell update path thin and memoize row components by row ID and version.
Fixed headers and frozen columns
The header row must stay at the top while scrolling vertically, and scroll with the body horizontally. Frozen columns must stay on the left while scrolling horizontally, and scroll with the body vertically. There are two common layouts.
CSS sticky. Use position: sticky with top: 0 on header cells. Use it with left: 0 on frozen cells. Keep both inside one scroll container. It is simple and stays perfectly in sync, because it is one scroller. Give sticky cells an opaque background and a higher z-index.
Four panes. Split into top-left, top-right, bottom-left, and bottom-right panes. Only the bottom-right pane scrolls. Sync the others by setting their transform from its scroll position. This scales better for canvas and very wide grids, but sync must happen in the same frame or panes will drift for a moment.
Column virtualization must skip frozen columns. They are always rendered, and the virtual window starts after them.
7. Deep dive: editing, keyboard model, selection, and clipboard
The keyboard model
A spreadsheet has two modes: navigation mode and edit mode. Users expect these keys.
Navigation mode. Arrow keys move the active cell. Tab and Shift+Tab move right and left. Enter moves down. Home and End go to row start and end. Ctrl+Home and Ctrl+End go to the first and last cell. Page Up and Page Down move by one screen. Ctrl+arrow jumps to the edge of the data region.
Starting an edit. Typing a character starts editing and replaces the content. F2 or Enter starts editing and keeps the content. Double click also starts editing.
Edit mode. Arrow keys move the caret inside the text. Enter commits and moves down. Tab commits and moves right. Escape cancels and restores the old value.
Selection. Shift+arrow extends the range. Ctrl+A selects all. Shift+Space selects the row and Ctrl+Space the column.
When the active cell moves outside the rendered window, scroll it into view first, then move focus to it. The virtualizer must render that row before focus can land on it.
One editor, positioned on top
Do not put an input in every cell. Keep one editor element and position it over the active cell when editing starts. Pick the editor by column type: a text input, a number input with locale-aware parsing, a date picker, or a combobox for enums. On commit, run the column's validate function. If invalid, keep the editor open and show the error next to it with aria-describedby.
Commit edits optimistically. Update the cell at once, mark it as saving with a subtle indicator, and send the save. On failure, keep the user's value visible with an error state and a retry option. Never silently revert, because the user would lose their input.
Tip
Handle IME correctly. When the user types the first character of a Japanese word in navigation mode, start edit mode without losing that character. Listen for compositionstart and keep the editor focused through the whole composition.
Range selection with the mouse
On pointerdown, set the anchor and call setPointerCapture so you keep getting events if the pointer leaves the grid. On pointermove, update the focus cell. If the pointer is near an edge, auto-scroll in a requestAnimationFrame loop with speed based on distance. Draw the selection as one absolutely positioned overlay rectangle per range, not by adding a class to every selected cell. A 10,000 cell selection then costs one element.
Copy and paste
Spreadsheets exchange data as tab-separated values (TSV). Excel and Google Sheets also put HTML on the clipboard.
Copy. Listen for the copy event. Build TSV from the selected range by reading the model, not the DOM, because most cells are not rendered. Call event.clipboardData.setData('text/plain', tsv) and also set text/html with a simple table markup for rich targets.
Paste. Listen for paste. Read text/plain, split by newline and tab, and handle quoted fields that contain tabs or newlines. Map values onto the grid starting at the active cell. If one value is pasted into a larger selection, fill the selection.
Validation. Parse each value by column type. Collect errors, apply valid cells, and show a summary like "480 cells pasted, 20 skipped".
Size. A paste of 100,000 cells must not freeze the page. Parse in a worker or in chunks, and send one batch save with an idempotency key.
Undo. Treat a paste as one undo step.
The async Clipboard API, navigator.clipboard.readText(), needs permission and focus. Use it for context menu actions. Prefer the copy and paste events for keyboard shortcuts, since they work without a prompt.
8. Deep dive: sorting and filtering on client versus server
Client-side
When all rows are in memory, sort and filter on the client. Never reorder the data itself. Build a new viewToModel index array. Sorting 1 million numbers in a typed array takes about 100 to 200 ms in a modern engine. Sorting objects with a comparator that reads string fields with localeCompare can take several seconds. So the following practices help.
Run sort and filter in a Web Worker. Send the column data once as transferable ArrayBuffers. Send only the sort spec after that. The worker returns a new Int32Array index, also transferred, so no copy is made.
Use Intl.Collator created once, not localeCompare per comparison. It is many times faster for strings.
Use a stable sort so rows with equal keys keep their previous order. Array.prototype.sort is stable in modern engines.
For filters, build a bitmask per filter and combine with AND. Changing one filter only recomputes its mask.
Keep the active cell on the same model row after sort. Find its new view index and scroll to it.
Server-side
When data does not fit on the client, the server sorts and filters. The client sends the spec with each block request. Every change to sort or filter invalidates the block cache. Use an AbortController to cancel requests for the old spec, so late responses do not fill the grid with rows from the wrong order.
Show the old rows dimmed with a progress bar while the new order loads. Do not blank the grid.
Offset pagination is simple but slow for deep pages in many databases. Cursor or keyset pagination is faster, but makes jumping to row 800,000 hard. A grid with a draggable scrollbar needs random access, so many systems allow offset queries with a cap or use an index.
Row count can be expensive. Show an estimate like "about 2.3 million rows" until the exact count returns.
Choosing
Under about 100,000 rows: load everything, client sort and filter, instant feedback.
100,000 to a few million: client mode with columnar storage and a worker, if memory allows.
Beyond that, or with strict access control per row: server mode.
Interview
State the threshold and the reason. "Under 100,000 rows the full dataset is about 20 MB, so I load it and sort in a worker. Above a few million, memory and download time push me to server mode." Numbers show you have thought about it.
9. Deep dive: formulas and dependency graph recalculation
Figure 2. Changing A1 recalculates only its dependents, in an order where inputs come first.
Parsing
When the user enters =SUM(B2:B10) * C1, the engine tokenizes and parses it into an abstract syntax tree (AST). It extracts references: the range B2:B10 and the cell C1. It stores the AST and adds edges to the dependency graph. Never evaluate formulas with eval or new Function. User formulas are untrusted input, and a shared sheet could run code in other users' browsers.
The graph
Store reverse edges, from a cell to the cells that depend on it. Recalculation walks forward from the changed cell.
Store large ranges as range nodes, not as thousands of single edges. =SUM(A1:A100000) should create one edge to a range, and the engine checks whether a changed cell falls inside it. Interval trees or per-column range indexes make this lookup fast.
Relative references like A1 shift when a formula is copied or rows are inserted. Absolute references like $A$1 do not. Row insertion must rewrite references in every affected formula.
Recalculation
On edit, mark the changed cell and all its transitive dependents as dirty.
Order the dirty cells topologically, so each cell runs after its inputs. Kahn's algorithm or a depth-first search both work.
If the ordering finds a cycle, mark the cells in it with a #CIRCULAR error and stop there.
Evaluate each dirty cell. If a value did not change, you can skip its dependents. This is called early cutoff.
Post the changed values to the main thread. The view repaints only cells that are visible.
Volatile functions like NOW() and RAND() are dirty on every recalc. Keep a list of them and recalc only on a timer or on explicit request.
Keeping the UI responsive
A sheet with 500,000 formulas can take seconds to recalc. Run the engine in a Web Worker. While it works, show changed cells with a subtle "calculating" state rather than old values that look final. That keeps the correctness contract. If the user edits again during a recalc, cancel the current pass with a generation number and start a new one. For very hot sheets, the engine can recalc visible cells first, then the rest, as long as it shows which cells are still pending.
Mistake
Recalculating the whole sheet on every edit. It works for 1,000 cells and becomes unusable at 100,000. Dirty marking plus topological order makes the cost proportional to what actually changed.
10. Deep dive: very large datasets, workers, and canvas
Loading in blocks
For server mode, split rows into blocks of, say, 200. Keep an LRU cache of about 50 blocks, which is 10,000 rows. When the viewport moves, request the visible blocks first, then one block ahead in the scroll direction. Cancel block requests that scroll out of view before they return. When a user drags the scrollbar to the middle, do not load every block on the way. Debounce by about 100 ms and load only where they stop.
Optionally persist recent blocks in IndexedDB for instant reload of the last view. Invalidate them with a dataset version from the server.
Web Workers
Move parsing of large CSV or JSON downloads to a worker. Parsing 100 MB of JSON on the main thread can block for several seconds.
Keep column data in the worker. The main thread asks only for the visible window and gets back small arrays.
Use transferable ArrayBuffers to move data without copying. For shared read access, SharedArrayBuffer works, but it needs cross-origin isolation headers: Cross-Origin-Opener-Policy: same-origin and Cross-Origin-Embedder-Policy: require-corp.
Run aggregations like sum, average, and count for the status bar in the worker, debounced after selection changes.
Canvas rendering
Google Sheets and some high-end grids draw cells on a canvas. The trade-off is clear.
Gains. No DOM nodes per cell, so zooming out to 10,000 visible cells is fine. Drawing text with fillText for a few thousand cells takes a few milliseconds. Scrolling can use a cached bitmap and draw only the new strip.
Costs. You must handle device pixel ratio for sharp text, measure and clip text yourself, draw focus rings, and build hit testing from coordinates. There is no native text selection, no links, and no accessibility tree.
Hybrid. Draw cells on canvas, but render the editor, the active cell, and context menus as DOM on top. Keep a parallel, virtualized DOM grid with ARIA roles, visually hidden, for screen readers. This is a lot of engineering, so choose canvas only when DOM cannot meet the budget.
An OffscreenCanvas can move drawing into a worker, which frees the main thread for input. Text measurement there is consistent, but font loading must happen in the worker too.
Tip
Start with a DOM renderer and strict virtualization. Measure on a low-end laptop. Move to canvas only if you need very dense views, like zoomed-out sheets or financial tickers with thousands of updates per second.
11. Deep dive: accessibility with the grid pattern
Roles and structure
The container has role="grid" and an accessible name with aria-label or aria-labelledby.
Rows have role="row". Header cells have role="columnheader". Data cells have role="gridcell". Frozen first columns can use role="rowheader".
Because most rows are not in the DOM, set aria-rowcount and aria-colcount on the grid to the full size. Set aria-rowindex on each rendered row and aria-colindex on each cell. Screen readers then say "row 4,012 of 1,000,000".
Sortable headers carry aria-sort="ascending", "descending", or "none". The sort control inside is a real button.
Selected cells have aria-selected="true". Read-only grids set aria-readonly="true".
Focus management
The grid should be one tab stop. Use a roving tabindex: the active cell has tabindex="0" and all others have -1. Arrow keys move focus with element.focus(). Another approach is aria-activedescendant on a focused container, which pairs well with virtualization because focus never moves to a recycled element. Either way, when a recycled element gets new content, make sure it does not keep focus for the wrong cell.
When the user presses Enter to edit, focus moves into the editor. Escape returns it to the cell. A cell may hold a link or a checkbox. Following the APG grid guidance, the user enters it with Enter or F2 and leaves with Escape.
Announcements
Announce sort and filter results in a polite live region, like "Sorted by price, ascending. 12,430 rows."
Announce save errors assertively, but only once per error.
Do not announce every scroll or cell value change. Focus movement already causes the screen reader to read the cell.
Formula cells should expose the computed value as text. Offer the formula itself through the editor or a description.
Interview
Mention that native browser find (Ctrl+F) cannot see unrendered rows. A good grid offers its own search box that searches the model and scrolls to matches.
12. Failure modes
Edit applied to the wrong row after sort. Always key edits by model row ID. Translate view to model at the moment of commit.
Late block response after a sort change. Abort old requests and tag responses with the sort generation. Drop mismatches.
Save conflict. The server returns 409. Show both values on the cell and let the user pick. For non-critical grids, last write wins with a notice.
Huge paste. Chunk the parse, show progress, and save as one batch with an idempotency key. On partial failure, mark failed cells.
Formula cycle. Detect during topological ordering. Show #CIRCULAR on the cells in the cycle.
Worker crash or out of memory. Catch the worker error event, restart it, and reload data. Fall back to server mode if the dataset is too large.
Scroll height cap exceeded. Use scaled scrolling for very tall grids.
Fast scrolling blank areas. Increase overscan in the scroll direction and show skeleton rows for loading blocks.
Font loading changes column widths. Wait for document.fonts.ready before measuring auto-sized columns.
13. Trade-offs
DOM versus canvas
DOM: native text, links, accessibility, and CSS styling.
Canvas: much higher density and steady frame times, but you rebuild many browser features.
Client versus server data
Client: instant sort and filter, works offline, but limited by memory and download size.
Server: unlimited size and row-level security, but each change needs a round trip.
Fixed versus variable row height
Fixed: simple O(1) math and perfect scrollbars.
Variable: wrapped text, but needs measurement, prefix sums, and scroll anchoring.
Sticky CSS versus split panes
Sticky: one scroller, simple, always in sync.
Split panes: more control and better for canvas, but sync must be frame exact.
14. 45-minute interview walkthrough
Minutes 0 to 5. Ask: grid or spreadsheet, row count, editing, collaboration, variable heights.
Minutes 5 to 10. Budgets: DOM cell count with and without virtualization, 16 ms frame, memory for 1 million rows, scroll height cap.
Minutes 10 to 15. Draw the layers: shell, virtualizer, model, data source, renderer, selection, editor, worker.
Minutes 15 to 19. Data model: column definitions, view-to-model index, ranges as coordinates, columnar storage.
Minutes 19 to 26. Virtualization: window math, prefix sums, row pool, transforms, frozen panes.
Minutes 26 to 32. Keyboard model, single editor, range selection overlay, TSV copy and paste.
Minutes 32 to 36. Sort and filter: client in a worker versus server with cancellation.
Minutes 40 to 45. Canvas versus DOM, ARIA grid pattern, and failure modes.
15. Summary
Virtualize rows and columns. Render about a thousand cells, never millions.
Use prefix sums and binary search for variable sizes, and transforms plus a row pool for smooth scroll.
Keep a view-to-model index and key every edit by model row ID.
Store selection as coordinate ranges and draw it as overlays.
Use one positioned editor, a two-mode keyboard model, and TSV for the clipboard.
Sort and filter in a worker with typed arrays on the client, or on the server with cancellation.
Recalculate formulas with a dirty set in topological order, in a worker, and detect cycles.
Choose canvas only when DOM cannot meet the budget, and keep an accessible layer.
Implement the ARIA grid pattern with row and column counts and indexes.
16. Common mistakes
Rendering every row and hoping the browser copes.
Using view indexes as identity for edits.
Storing selection as a set of cells.
Putting an input element in every cell.
Reading copy data from the DOM instead of the model.
Sorting on the main thread with localeCompare on a million rows.
Evaluating formulas with eval.
Recalculating the whole sheet on each edit.
Forgetting aria-rowcount and aria-rowindex in a virtualized grid.
Worked example: paste 500 rows into a sorted, filtered grid
An orders grid has 200,000 rows loaded in client mode. It is sorted by date descending and filtered to status "open", which leaves 18,000 rows. The user copies 500 rows by 3 columns from Excel and pastes at view row 100, column "Qty".
The paste event fires on the grid. The handler reads text/plain and gets 500 lines of TSV, about 12 KB.
The text goes to the worker, which splits lines and tabs and handles quoted fields. It returns a 500 by 3 array in about 5 ms.
The target range is view rows 100 to 599 and columns Qty, Price, and Status. The grid translates each view row to its model row ID through viewToModel, before anything else changes.
Each value is parsed by column type. Qty and Price use locale-aware number parsing. 7 Price values fail validation because they contain text.
The grid applies 1,493 valid values to the model and marks them as saving in pendingEdits, keyed by model row ID and column ID. It records one undo step.
Some pasted Status values are "closed". Those rows no longer match the filter. The grid does not remove them at once, which would make rows jump under the user. It keeps them visible with a "hidden by filter after refresh" style until the next filter change.
The visible cells repaint. Only about 40 rendered rows change in the DOM.
One batch request goes to POST /rows/batch with an idempotency key. The server accepts all 1,493 values.
The grid clears the saving state. A polite live region says "1,493 cells pasted, 7 skipped". The 7 failed cells show an error outline with a tooltip.
The user presses Ctrl+Z. The undo step restores all 1,493 old values and sends one more batch save.
Code lab: dirty-set formula recalculation
This snippet builds a tiny formula engine. Each formula lists its inputs and a pure function. Changing a cell marks dependents dirty, orders them topologically, detects cycles, and skips unchanged values. Save it as sheet.mjs and run node sheet.mjs.
class Sheet {
  constructor() { this.cells = new Map(); this.dependents = new Map() }

  set(id, value) { this.cells.set(id, { value }); return this.recalc([id]) }

  formula(id, deps, fn) {
    this.cells.set(id, { deps, fn, value: undefined })
    for (const d of deps) {
      if (!this.dependents.has(d)) this.dependents.set(d, new Set())
      this.dependents.get(d).add(id)
    }
    return this.recalc([id])
  }

  get(id) { return this.cells.get(id)?.value ?? 0 }

  recalc(changed) {
    const dirty = new Set()
    const stack = [...changed]
    while (stack.length) {                       // 1. collect transitive dependents
      const id = stack.pop()
      for (const dep of this.dependents.get(id) ?? []) if (!dirty.has(dep)) { dirty.add(dep); stack.push(dep) }
    }
    for (const id of changed) if (this.cells.get(id)?.fn) dirty.add(id)
    const indeg = new Map([...dirty].map((id) => [id, 0]))   // 2. Kahn's algorithm on the dirty subgraph
    for (const id of dirty) for (const d of this.cells.get(id).deps) if (dirty.has(d)) indeg.set(id, indeg.get(id) + 1)
    const queue = [...dirty].filter((id) => indeg.get(id) === 0)
    const updated = []
    while (queue.length) {
      const id = queue.shift()
      const cell = this.cells.get(id)
      const next = cell.fn(...cell.deps.map((d) => this.get(d)))
      if (next !== cell.value) { cell.value = next; updated.push(id) }   // 3. early cutoff is possible here
      for (const dep of this.dependents.get(id) ?? []) {
        if (!dirty.has(dep)) continue
        indeg.set(dep, indeg.get(dep) - 1)
        if (indeg.get(dep) === 0) queue.push(dep)
      }
    }
    for (const [id, n] of indeg) if (n > 0) { this.cells.get(id).value = '#CIRCULAR'; updated.push(id) }
    return updated
  }
}

const s = new Sheet()
s.set('A1', 5)
s.formula('B1', ['A1'], (a) => a * 2)
s.formula('C1', ['A1', 'B1'], (a, b) => a + b)
s.formula('D1', ['B1', 'C1'], (b, c) => b + c)
console.log('after A1=7, updated:', s.set('A1', 7), 'D1 =', s.get('D1'))   // B1, C1, D1 and 35
s.formula('E1', ['F1'], (f) => f + 1)
console.log('cycle:', s.formula('F1', ['E1'], (e) => e + 1), s.get('E1'))  // both #CIRCULAR
The comment marks where early cutoff fits. Try adding it. Track which cells really changed, and skip evaluating a dirty cell when none of its inputs changed. Then add a cell G1 that clamps A1 to a maximum of 3, and watch its dependents skip work.
Check yourself
A grid has 500,000 rows at 32 pixels each in a 960 pixel viewport with 5 rows of overscan on each side. How many rows are rendered, and how tall is the spacer?Answer
960 divided by 32 is 30 visible rows, plus 1 for a partial row and 10 for overscan, so about 41 rows. The spacer is 500,000 times 32, which is 16 million pixels. That is under Chrome's cap but close to Firefox's, so scaled scrolling may be needed.
Why must edits be keyed by model row ID rather than view row index?Answer
Sorting, filtering, and inserts change view indexes. A pending save keyed by view index would land on a different row after a re-sort. Model row IDs stay stable.
Why should copy read from the data model and not from the DOM?Answer
With virtualization, most selected cells are not rendered. The DOM only holds the visible window, so reading it would copy a fraction of the range or formatted text instead of raw values.
What do aria-rowcount and aria-rowindex solve in a virtualized grid?Answer
They tell assistive technology the full size of the grid and the true position of each rendered row. Without them a screen reader would announce "row 3 of 41" instead of "row 4,012 of 500,000".
When does canvas rendering beat DOM rendering, and what do you lose?Answer
Canvas wins when you show many thousands of cells at once or update them very often, because there is no per-cell style and layout. You lose native text selection, links, focus rings, hit testing, and the accessibility tree, so you must rebuild them.
In formula recalculation, why use a topological order instead of evaluating dirty cells in any order?Answer
A cell must run after all its inputs are updated. In random order, a cell could compute with a stale input and show a wrong value, or need several passes. Topological order guarantees one correct pass and also exposes cycles.
Where should a 1 million row client-side sort run, and how do you avoid copying data?Answer
In a Web Worker, so the main thread stays responsive. Store columns as typed arrays and send them as transferable ArrayBuffers. The worker returns the new index array the same way.
Key terms
Virtualization
Rendering only the visible part of a large list or grid.
Overscan
Extra rows or columns rendered outside the viewport to hide blank flashes.
Prefix sum
An array where each entry is the total size of all items before it.
Frozen column
A column that stays fixed while the rest scroll horizontally.
View-to-model index
An array that maps a row's displayed position to its source row.
Active cell
The single cell that holds keyboard focus.
Range selection
A rectangle of cells defined by an anchor and a focus cell.
TSV
Tab-separated values, the format spreadsheets use on the clipboard.
Dependency graph
Links from cells to the formula cells that use them.
Topological order
An order where each node comes after all nodes it depends on.
Transferable
An object, like an ArrayBuffer, moved to a worker without copying.
Roving tabindex
A focus technique where only one item in a widget is in the tab order.